


Job requirements are changing faster than most org charts. New tools, new regulations, and new customer expectations keep rewriting what a “qualified” employee looks like. That is why workforce development statistics matter: they show where skills are falling behind and where your training budget will do the most good.
This guide covers skills gaps, training, upskilling, career growth, AI, and measurement. It also shows you how to judge a statistic before you put it in a board deck.
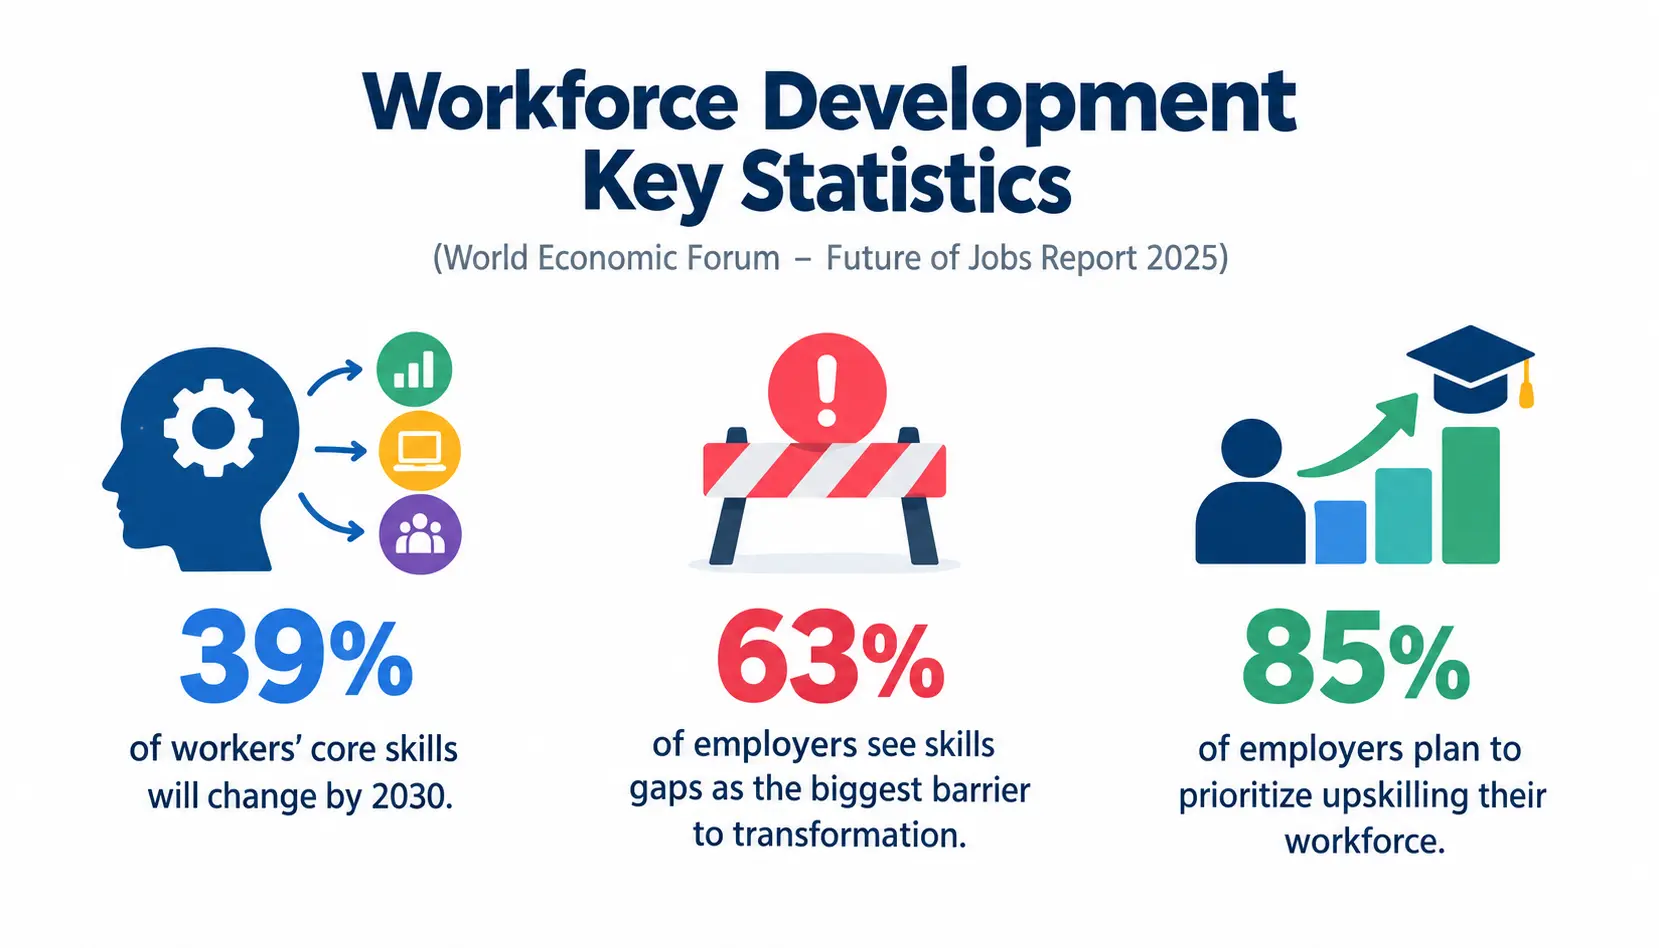
A few headline numbers from the World Economic Forum’s Future of Jobs Report 2025:
- Employers expect about 39% of workers’ core skills to change by 2030.
- About 63% of employers name skills gaps as the biggest barrier to business transformation.
- About 85% of employers plan to prioritize upskilling their workforce.
Two cautions before we go on. These are employer expectations from a survey, not measured outcomes. And figures differ by country, industry, company size, and research method, so always check the original source.
Key Workforce Development Statistics at a Glance
This table uses only figures I could attribute to a named report. Where a number depends on a specific survey edition, I’ve told you to pull it from the original rather than guess.
| Statistic | Finding | Source and year |
| Skills disruption | About 39% of core skills expected to change by 2030 | WEF, Future of Jobs 2025 |
| Upskilling priorities | About 85% of employers plan to prioritize upskilling | WEF, 2025 |
| Training need | Of 100 workers, about 59 are expected to need training by 2030 | WEF, 2025 |
| Skills gaps | About 63% of employers cite skills gaps as a major barrier to transformation | WEF, 2025 |
| Employee development | Employees’ views on growth support vary by year and country | Gallup workplace research (check latest edition) |
| Training investment | Spend and hours per employee differ by industry and methodology | Verify in original research (for example, ATD or LinkedIn Learning reports) |
| Career development | Workers consistently rank growth opportunities as a retention factor | LinkedIn Workplace Learning Report (check latest edition) |
The WEF report is based on a survey of more than 1,000 employers, representing over 14 million workers across 55 economies. That is a large sample, but it is still a survey of employers, not a census of workers.
What Is Workforce Development?
Workforce development is the set of actions that help people build the skills, experience, and career paths an organization (or an economy) needs. Training is one part of it. Hiring strategy, coaching, mentoring, job design, and internal mobility are the others.
The workforce development gives a useful public-policy view. In companies, the same idea shows up as talent development.
Workforce development vs. employee training
Training is a single tool. Workforce development is the whole toolbox plus the plan.
A two-day safety course is training. Mapping the skills your plant will need in three years, then building a mix of courses, apprenticeships, and job rotations to get there, is workforce development.
Workforce development vs. workforce planning
Workforce planning asks, “How many people and which roles will we need?” Workforce development asks, “Can our people grow into those roles?”
The two should talk to each other. A plan that forecasts 40 new data roles means little if no one is building the data skills internally.
Why workforce development statistics matter
Good data helps you:
- Spot skills shortages before they slow delivery.
- Prioritize training budgets.
- Support internal mobility.
- Improve workforce readiness.
- Judge your organization’s overall capability.
In my experience, the biggest value is not the headline number. It is the argument you can make with it. A credible, sourced statistic turns “we should invest in training” into a budget conversation.
Workforce Skills Gap Statistics
How widespread are workforce skills gaps?
Quite widespread, according to employers. In the WEF’s 2025 survey, roughly 63% said skills gaps are the main barrier to transforming their business over the next five years. That made it the most-cited barrier in the report.
What does this tell us? Organizations are changing strategy faster than they are changing capability. Technology is usually the trigger, but people are the bottleneck.
Skills expected to change by 2030
The WEF reports that employers expect about 39% of workers’ core skills to change by 2030. That is lower than the figure in its 2023 edition, which suggests some of the early churn has already happened.
Remember what this number is. It is an expectation. Observed change, measured through job postings or performance data, can look different.
The most important skills for the future workforce
The WEF and other labor-market studies keep pointing to the same clusters.
Digital and AI literacy
This means using digital tools confidently and understanding what AI can and cannot do. Employers rank technology skills, including AI and big data, among the fastest-growing in demand.
Analytical thinking and problem-solving
Analytical thinking was the top core skill in the WEF’s employer survey. It is the ability to break down a messy problem and decide what to do next.
Leadership and communication
People who can lead, influence, and explain complex ideas remain scarce. These skills also tend to travel well between roles, which helps with mobility.
Adaptability and creative thinking
Resilience, flexibility, and creative thinking sit near the top of employer priorities. They matter most where roles shift often.
Technical and role-specific skills
Do not lose sight of the basics. Welding, nursing procedures, and financial controls all need role-specific depth that no general course replaces.
How skills gaps vary by industry and geography
Gaps differ a lot. A hospital worries about clinical credentials. A software firm worries about AI engineering. A manufacturer worries about aging technicians.
Compare sectors or countries only when the source uses the same definitions. Otherwise you are comparing two different questions.
Employee Training and Learning and Development Statistics
Employee training participation and completion rates
Be precise about what a rate measures. Enrollment, attendance, completion, and demonstrated competence are four different things.
I once reviewed a program that reported 92% completion. When we tested the skill on the job, fewer than half of the learners could apply it. Completion told us people clicked through. It did not tell us they learned.
Corporate training spending and hours per employee
Industry bodies such as ATD and LinkedIn Learning publish annual benchmarks on spending and hours. For a broader overview of training benchmarks, see our guide to employee training statistics. Check the year, the population, and whether the figures include salaries and travel.
Employee preferences for workplace learning
Preferences vary by role and generation, but these formats come up most:
- On-the-job training: Learning by doing, often with a coach nearby.
- Instructor-led learning: Best for complex or sensitive topics.
- Self-paced digital learning: Flexible, but it needs motivation and manager support.
- Coaching and mentoring: Strong for leadership and career growth.
- Microlearning and blended learning: Short lessons mixed with practice work well for busy teams.
Treat preference surveys as a guide, not a verdict. People often prefer the format they know, which is not always the one that works best.
Frontline and deskless workforce training statistics
Most frontline workers cannot sit at a desk for an hour of e-learning. Shift schedules, limited device access, and pressure to keep operations running all get in the way.
The fixes are practical. Use mobile-friendly modules, five-minute lessons, and training built into the shift. A retail manager I worked with moved a 40-minute course into eight short huddles. Participation rose because no one had to leave the floor.
Learning technology adoption
Learning management systems (LMS)
A learning management system hosts, assigns, and tracks training. It is the backbone of compliance learning in most mid-size and large organizations.
Learning experience platforms (LXP)
An LXP focuses on discovery. It recommends content based on a learner’s role and interests rather than simply assigning it.
AI-assisted learning and adaptive training
These tools adjust content to the learner’s level. They are promising, but adoption figures change quickly, so use the most recent dated source.
Upskilling and Reskilling Statistics
How many employers are prioritizing upskilling?
The WEF’s 2025 survey found that about 85% of employers plan to prioritize upskilling their workforce. About 70% expect to hire staff with new skills, and around 40% expect to reduce staff where skills become less relevant.
The scope matters. This is a global employer survey, so intentions may not match what happens at your company.
The same report estimates that if the world had 100 workers, 59 would need training by 2030. Of those, about 29 could be upskilled in their current roles, about 19 could be upskilled and redeployed, and about 11 were unlikely to receive the training they need.
Upskilling vs. reskilling: Key differences
| Upskilling | Reskilling |
| Develops skills for a current or related role | Develops skills for a different role or career path |
| Builds on existing capabilities | May require a larger change in capabilities |
| Example: An analyst learning advanced data tools | Example: An employee retraining for a data analyst role |
Why organizations invest in internal talent development
- Skill requirements keep changing.
- Internal career paths help people see a future.
- A flexible workforce responds faster to new demand.
- Development supports retention and succession planning.
- Where internal skills are close enough, it can reduce reliance on external hiring.
External hiring is still right for some gaps, especially when you need a skill immediately and no one inside has it.
Skills-based hiring and internal mobility trends
More organizations now match people to roles by skills rather than job titles. Internal talent marketplaces use skills data to suggest projects and open roles to employees.
This only works if your skills data is current. Stale profiles produce bad matches and erode trust fast.
Career Development and Employee Retention Statistics
Employee demand for career growth
Surveys from Gallup and LinkedIn regularly find that many employees want clearer growth paths. Exact percentages change each year and by country, so pull the latest edition from Gallup’s workplace research or the LinkedIn Workplace Learning Report.
The pattern is steady even when the numbers move. People stay where they feel they are growing.
Career development and retention
Growth opportunities and intent to stay tend to move together. That is a correlation, not proof of cause.
Pay, manager quality, workload, and local job markets all affect turnover too. Be careful with claims like “training cuts turnover by X%” unless the study controls for those factors.
Internal promotion and career mobility
Look at promotion rates, internal hires, lateral moves, and the share of employees with an active development plan. Publicly comparable benchmarks are limited, so your own year-over-year trend is often the most useful data.
Manager support and employee development
Managers decide whether new skills get used. A strong course followed by a manager who says “no time for that” wastes the investment.
Give managers a simple role. Set goals before training, check in during it, and assign a real task afterward.
Workforce Development, Productivity, and Business Performance Statistics
Does employee training improve productivity?
Often, yes, but the strength of the evidence varies. Well-designed studies that compare trained and untrained groups give the clearest answers. Many corporate figures come from self-reports, which are weaker.
Ask three questions of any productivity claim. What was measured? Against what comparison? Over what time period?
Workforce development and employee engagement
Engagement research links growth opportunities with motivation and a better workplace experience. Employee engagement is shaped by many things, so development is one lever, not the only one.
Training and employee retention costs
Replacing an employee can cost a meaningful share of their annual pay, though estimates vary widely by role and method. If development helps keep people, the savings can be real.
Still, count other factors that influence turnover. Don’t credit training for everything.
Measuring training ROI
Return on investment compares benefits to costs.
Training ROI (%) = (Monetary benefits − Program costs) ÷ Program costs × 100
Hypothetical example: A program costs $10,000 and produces 15,000indefensiblyestimatedbenefits.TheROIis(15,000 − $10,000) ÷ $10,000 × 100 = 50%.
The hard part is the “defensibly estimated” benefit. Use operational data, such as fewer errors or faster onboarding, and agree on the method with finance before the program starts.
Why training completion does not always equal business impact
Finishing a course is not the same as changing how work is done. Impact needs four things:
- Assessment that checks real skill.
- Practice with feedback.
- Manager support.
- A chance to apply the skill soon after learning it.
AI and Technology Workforce Development Statistics
How AI is changing workforce skill requirements
AI is changing tasks within jobs faster than it is eliminating whole jobs. The WEF’s 2025 report ranks AI and big data among the fastest-growing skills. It also projects about 170 million new roles and 92 million displaced roles by 2030, a net gain of about 78 million.
These are projections. Treat them as scenarios to plan around, not promises.
AI training and digital skills development
Keep four things separate:
- Employees using AI tools.
- Employers adopting AI.
- Access to AI training.
- Demonstrated proficiency.
A statistic about the first rarely says anything about the last. Many surveys blur them.
AI-powered personalized learning
Adaptive pathways, skills assessments, and content recommendations can save learners time. They do not automatically improve results. Pilot first, compare against a control group if you can, and measure outcomes. AI-powered learning is part of a broader shift toward continuous, skills-based development. Explore the latest workplace learning trends to understand how personalized learning, on-the-job practice, and skills development are shaping employee training.
How organizations can prepare employees for technological change
- Identify affected roles and tasks.
- Map current and future skills.
- Prioritize the training with the biggest impact.
- Provide supervised practice.
- Evaluate proficiency and workplace outcomes.
Workforce Development Statistics by Industry
Use industry comparisons only when sources define terms the same way. A “training hour” in healthcare often includes mandatory compliance, while in tech it may be voluntary learning.
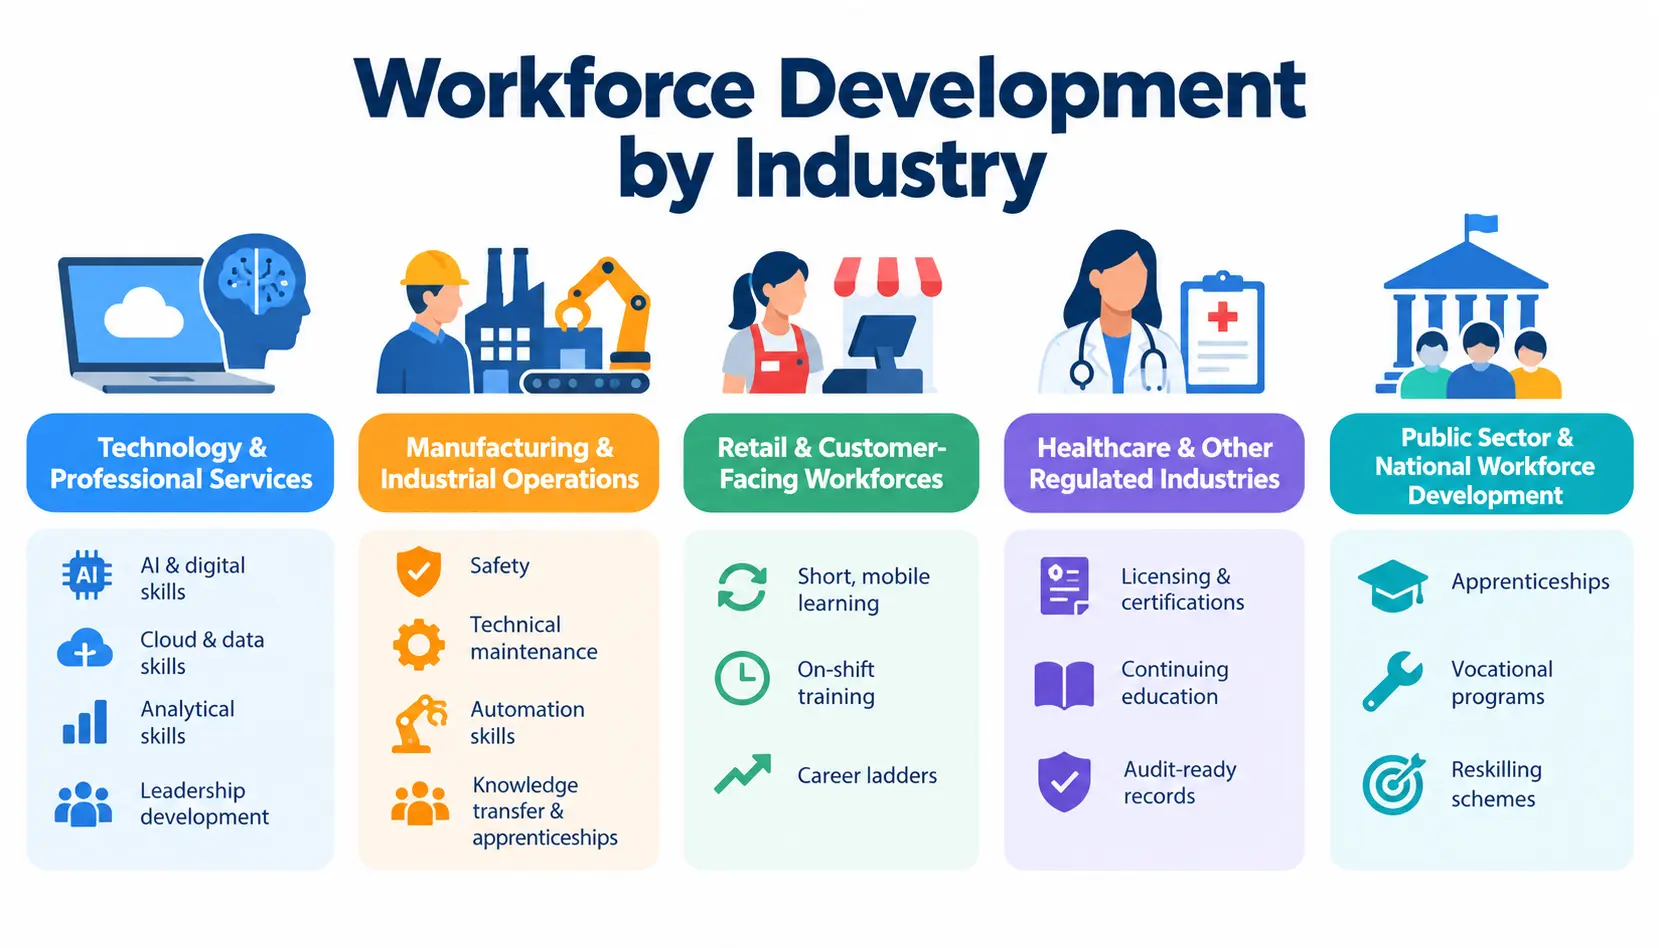
Technology and professional services
Skills turn over quickly here. Expect heavy demand for AI, cloud, data, and analytical skills, plus a steady need for leadership development.
Manufacturing and industrial operations
Safety, technical maintenance, and automation skills dominate. Aging workforces make knowledge transfer and apprenticeships especially important.
Retail and customer-facing workforces
High turnover and shift work shape training. Short, mobile, on-shift learning fits best, and career ladders help retention.
Healthcare and other regulated industries
Regulation sets a floor. Licensing, continuing education, and audit-ready records drive much of the training volume.
Public sector and national workforce development
Governments run apprenticeships, vocational programs, and reskilling schemes. Priorities depend on local labor markets, funding, and policy goals.
The Most Important Workforce Development KPIs to Track
Skills gap closure rate
The share of identified skills gaps that have been addressed and verified. Define “verified” up front, for example through an assessment or manager sign-off.
Training completion rate
Completion rate (%) = Employees completing training ÷ Employees enrolled × 100
Skills proficiency rate
The share of assessed employees who meet a defined competency standard.
Time to proficiency
How long it takes employees to reach a defined performance or competency threshold. It is especially useful for onboarding.
Internal mobility rate
The percentage of eligible employees who move into other internal roles in a set period.
Employee retention and turnover
Track both by cohort, role, location, or training participation where appropriate.
Training cost per employee
Total training spend divided by a clearly defined employee population. State what the cost includes.
Training ROI and business impact
Connect training to defensible estimates of productivity, quality, revenue, or cost savings. Use the ROI formula above and document your assumptions.
How to Use Workforce Development Statistics to Improve Organizational Strategy
Step 1 — Establish a baseline
Gather current data on skills, training, performance, and staffing. Without a baseline, you cannot show progress.
Step 2 — Identify priority skills gaps
Compare today’s competencies with current and expected job requirements. Focus on gaps that affect business goals.
Step 3 — Select the right development interventions
Match the fix to the gap. Use training for knowledge, coaching for behavior, mentoring for careers, reskilling for role changes, and external hiring when time is short. Once you identify the priority skills gaps, the next step is to turn them into a structured learning plan. Our guide explains how to build an effective employee training program, from assessing training needs to setting learning objectives and measuring results.
Step 4 — Measure learning and workplace application
Use assessments, manager observations, and operational metrics. Check back after 30 to 90 days.
Step 5 — Review results and update the plan
Compare results with your baseline. Drop what is not working and fund what is.
How to Evaluate Workforce Development Statistics and Research
This step separates useful data from marketing. Search results often mix institutional research, academic papers, and vendor blog posts.
Check the original source and publication date
Find the report itself, not a blog that quotes it. Note the year, and don’t present an older figure as current.
Review sample size, geography, and population
A survey of 200 US tech firms says little about global manufacturing.
Separate survey findings from projections
“Employers expect” and “workers have” are different claims.
Check whether results are independently verified
Self-reported results, such as “our training improved performance by 30%,” deserve more scrutiny than independently audited ones.
Avoid comparing incompatible statistics
Different definitions of training, skills, or employee make comparisons misleading.
Account for commercial sponsorship and research limitations
Vendors have reasons to publish findings that favor their products. That does not make the data wrong, but read it with care and look for independent confirmation.
Frequently Asked Questions About Workforce Development Statistics
1. What are the most important workforce development statistics?
The most useful ones cover skills gaps, training participation, upskilling priorities, and development outcomes. Examples include the share of core skills expected to change, employers citing skills gaps as a barrier, and the proportion of workers expected to need training. Always pair them with their source and year.
2. What percentage of workers’ skills will change by 2030?
The World Economic Forum’s Future of Jobs Report 2025 says employers expect about 39% of workers’ core skills to change by 2030. This is an employer expectation from a survey, not a measured result.
3. What is the difference between workforce development and employee training?
Employee training teaches specific skills or knowledge, usually through a course or program. Workforce development is broader. It includes training plus career paths, coaching, internal mobility, and planning for future skills.
4. How do organizations measure workforce development?
Common measures are skills gap closure, training completion, skills proficiency, time to proficiency, internal mobility, retention and turnover, training cost per employee, and business-impact or ROI estimates.
5. How can companies measure training ROI?
Use this formula: (Monetary benefits − Program costs) ÷ Program costs × 100. For example, $15,000 in benefits against a $10,000 cost gives a 50% ROI. The main limit is attribution, since other factors can influence the same results.
6. Which organizations publish reliable workforce development statistics?
Start with the World Economic Forum, Gallup, LinkedIn Learning, ATD, the OECD, the International Labour Organization, and national labor agencies such as the US Bureau of Labor Statistics. Always open the original report and check the year and method.
Conclusion
Workforce development statistics are only useful when they change a decision. The big picture is clear: skills are shifting, employers are worried about gaps, and most plan to invest in upskilling.
But your own data matters more than any global average. Set a baseline, pick a few KPIs, measure real skill use on the job, and be honest about what the numbers can and cannot prove.
Start small. Choose one critical skills gap this quarter, run a focused program, and measure the result. Then use what you learn to make the next case for investment.