


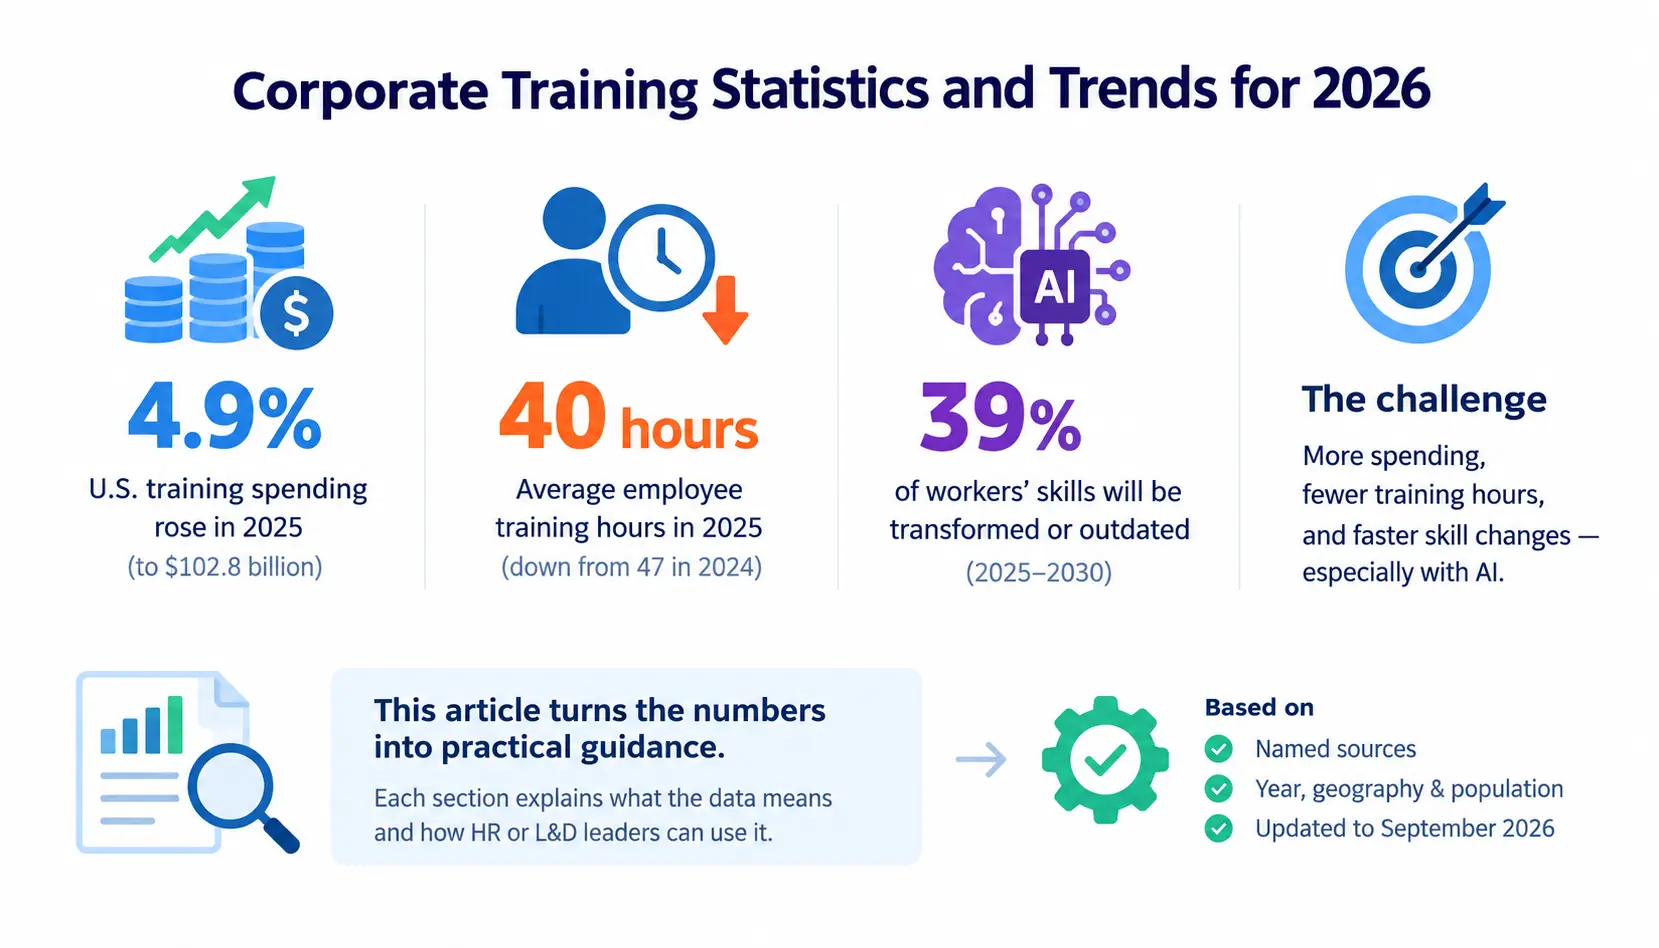
Corporate training statistics for 2026 tell a split story. U.S. training spending rose 4.9% to $102.8 billion in 2025, yet the average employee received 40 hours of training, down from 47 the year before. Companies are spending more and putting people in fewer training hours.
At the same time, skill requirements keep moving. Employers expect 39% of workers’ existing skill sets to be transformed or become outdated between 2025 and 2030. AI is a big part of that shift, and training is struggling to keep pace with it.
This article combines statistics, trends and practical interpretation. The numbers alone won’t help you write a budget or defend a program, so each section says what the data means and how an HR or L&D leader can use it.
A quick note on methods. Every figure below comes from a named source, and I give the year, geography and population wherever the publisher provides them. I checked the main figures against publisher pages as of September 2026. The full methodology section near the end explains why some of these numbers can’t be compared with each other.
Corporate Training Statistics at a Glance
Here are the 20 figures most worth knowing this year. Read the “Geography” and “Population” columns before you quote any of them, because that is where most benchmarking mistakes start.
The 15–20 Most Important Corporate Training Statistics for 2026
| Statistic | Figure | Data year | Geography | Population | Source |
| Total training spend | $102.8 billion, up 4.9% | 2025 | U.S. | Organizations with 100+ employees, weighted | Training Magazine, 2025 Industry Report |
| Spend per learner | $874, up from $774 | 2025 | U.S. | Same | Training Magazine |
| Training hours per employee | 40 hours, down from 47 | 2025 | U.S. | Same | Training Magazine |
| Large-company budget | $11.7 million average (midsize $1.6 million; small $333,305) | 2025 | U.S. | Same | Training Magazine |
| Direct spend per employee | $846, a $408 drop from 2024 | 2025 | Participating organizations | 340 organizations | ATD, 2026 State of the Industry |
| Formal learning hours | 16.7 hours, up from 13.7 | 2025 | Participating organizations | Same | ATD |
| Skills expected to change | 39% of existing skill sets by 2030 | 2025–2030 outlook | Global | 1,000+ employers, 55 economies | World Economic Forum, Future of Jobs 2025 |
| Workers needing training | 59 of every 100 workers by 2030 | 2025–2030 outlook | Global | Same | WEF |
| Skills gaps as a barrier | 63% of employers name them a major barrier | 2025–2030 outlook | Global | Same | WEF |
| Employer upskilling priority | 85% plan to prioritize upskilling | 2025–2030 outlook | Global | Same | WEF |
| AI use at work | 52% of U.S. employees, up from 27% two years earlier | Q2 2026 | U.S. | Employed adults | Gallup |
| Organizational AI adoption | 47% say their organization has integrated AI tools | Q2 2026 | U.S. | 22,573 employed adults | Gallup (via AGORA summary) |
| AI in training operations | 37% of training organizations use AI, up from 25% | 2025 | U.S. | Organizations with 100+ employees | Training Magazine |
| Employees with no AI training | About 35% have received none | 2026 | Not specified | Employees surveyed (vendor survey) | Study.com |
| Retention concern | 88% of organizations are concerned; learning is the top retention strategy | 2025 | Global | L&D and talent professionals | LinkedIn Workplace Learning Report |
| Leadership training | 71% of organizations offer it | 2025 | Global | Same | |
| Manager effect on engagement | At least 70% of the variance in engagement scores across business units | Analysis published 2015 | U.S. | Business units in Gallup’s database | Gallup |
| Market size | $427.3 billion in 2025, $458.7 billion in 2026 | 2025–2026 | Global | Market revenue estimate | Grand View Research |
| Budget direction | 41% increased, 16% decreased, 43% unchanged | 2025 | U.S. | Organizations with 100+ employees | Training Magazine |
| Measuring outcomes | Fewer than a quarter measure whether programs hit organizational goals | 2025 | Participating organizations | 340 organizations | ATD |
Two things stand out. Spending per person and total spending are up, but hours are down in one major survey and up in another. That is the first hint that “how much training” depends heavily on who is counting and how.
Corporate Training Market Size in 2026
How much is the global corporate training market worth?
The global corporate training market is worth roughly $430 to $460 billion in 2026, depending on the research firm. Grand View Research valued it at $427.3 billion in 2025 and estimates $458.7 billion for 2026. 360iResearch lands close by, at $427.42 billion for 2025 and $460.12 billion for 2026.
The Business Research Company, sold through Research and Markets, is a little lower: $439.82 billion for 2026. The gaps come from scope. Some analysts count only software and platforms, while others include content, services and instructor-led delivery.
How fast is the corporate training market growing?
Most forecasts put growth at roughly 5% to 8% a year. Grand View projects a 7.8% CAGR from 2026 to 2033, reaching $777.5 billion. The Research and Markets report projects a slower 5.3% CAGR, reaching $541.3 billion by 2030.
Treat these as directional. A forecast is a model with assumptions, and two firms can reasonably disagree by a few points.
Which regions account for corporate training demand?
North America leads. It held a 37.8% revenue share in 2025, with the U.S. as the largest country market and Asia Pacific as the fastest-growing region.
Which industries spend heavily on corporate training?
By market revenue, technology-related sectors lead. Grand View reports that IT and telecom was the largest end-use segment in 2025, and technical training was the largest training type.
On a per-learner basis, the picture differs. Retailers and wholesalers spent the most per learner at $1,046, followed by services organizations at $944. Big market revenue and high spend per person are different measurements.
Corporate training market size vs company training spend
These two numbers answer different questions, so don’t use them interchangeably. Market size counts what vendors earn from selling training products and services. Company training spend counts what employers put out, including payroll for training staff, technology, outside vendors and travel.
Training Magazine’s $102.8 billion includes budgets, technology and staff salaries for U.S. organizations with 100 or more employees. A global vendor-revenue figure of about $430 billion covers a wider geography and a different scope. Putting them side by side as “U.S. share of the market” produces a number that looks tidy and means little.
Corporate Training Spending Statistics
How much do companies spend on employee training?
U.S. organizations with 100 or more employees spent $102.8 billion on training in 2025. Inside that total, payroll for training staff rose nearly 7% to $64.7 billion, and spending on outside products and services rose 29% to $16 billion.
The 29% jump matters. Companies are buying more content, platforms and AI tooling from vendors instead of building everything in-house.
Average training spend per employee
The two most-cited benchmarks are close in size but measure different things. ATD’s 2026 report puts average direct learning expenditure at $846 per employee for 2025. Training Magazine reports $874 per learner.
The gap between “per employee” and “per learner” is not technical. Per learner counts only the people who took training, not total headcount. If 120 of your 200 people touched a course, quoting a per-learner benchmark against your headcount will overstate your peers’ spend by nearly 40%.
ATD’s own history also shows how much a single edition can swing. Direct expenditure per employee fell from $1,254 in 2024 to $846 in 2025. That is a large one-year move for a survey sample of a few hundred organizations, so treat the direction as informative and the exact size with caution.
Average training spend per learner
Spend per learner rose from $774 in 2024 to $874 in 2025. Use it as a starting point for a budget conversation, then adjust for your industry and company size.
Training budgets by company size
Smaller companies spend more per learner, while larger ones spend more in total. That pattern comes from economies of scale.
| Company size | Average total training budget | Spend per learner | What it means |
| Large | $11.7 million | $468 | Fixed costs like platforms and design are spread over many learners |
| Midsize | $1.6 million | $782 | Enough scale for an LMS, not enough to spread costs thinly |
| Small | $333,305 | $1,091 | Smallest budgets, highest cost per person |
Source: Training Magazine, 2025 Industry Report, U.S. organizations with 100+ employees. “Small” here still means 100 or more employees, so companies under 100 are outside this data. Small firms in this dataset are numerous enough that they account for almost one-third of total U.S. training spend.
Training spend by industry
Retail and wholesale led per-learner spend at $1,046, with services at $944. Training hours follow a different order. Services organizations offered the most hours on average (51), and large services organizations the most by company size (62).
Industry-level figures beyond these are mostly paywalled or come from secondary sources that don’t cite their samples. I would not quote a per-industry benchmark unless you can trace it to a named survey.
Where corporate training budgets are going
Compliance and management training take the largest slices. Mandatory compliance and management or supervisory training each received 13% of the average budget, with IT and systems training and onboarding each at 11%. Technology tools are a separate line: organizations spent 13% of their budget, or $290,987 on average, on learning tools and technologies.
Growth is heading toward leadership and AI. Thirty percent of organizations said management and supervisory training would get more funding, followed by AI training at 25%, interpersonal skills at 22% and onboarding at 21%.
Instructor-led delivery still holds a large share of the hours (covered in the next section).
Employee Training Hours and Participation Statistics
How many hours of training does an employee receive?
The answer depends on which survey you ask. Training Magazine reports 40 hours per employee in 2025. ATD reports 16.7 formal learning hours used per employee.
Both are legitimate. They sample different organizations and define hours differently, so don’t average them or treat one as a correction of the other.
How training hours are changing
The two surveys moved in opposite directions this year. Training Magazine’s average fell from 47 to 40 hours, while ATD’s rose from 13.7 to 16.7, the first increase in five years.
ATD suggests some of the budget decline behind its hours increase comes from cheaper delivery. It points to virtual instructor-led classrooms cutting travel costs, smaller talent-development teams and automated administration.
Training frequency by delivery method
Online and classroom delivery still dominate. In 2025, 34% of training hours were delivered online, 28% in an instructor-led classroom, 24% through virtual classrooms and webcasts, and 22% through blended learning. These categories overlap, so they don’t add up to 100%.
Newer formats are small but growing. Mobile and social learning each accounted for 6% of hours, and AI-delivered hours rose from 0.8% to 2%.
Why training hours are not the same as training effectiveness
Hours measure exposure, not learning. A team can log 40 hours of video modules and change nothing about how it works.
Picture a 300-person regional logistics firm where every dispatcher completes the same four-hour safety course each year. The hours look healthy on the dashboard, but incident rates don’t move because the course never covers the specific situations dispatchers face. Hours told the company how much time was spent. They said nothing about whether the training worked.
The Biggest Corporate Training Trends in 2026
AI now sits inside the learning workflow as well as the curriculum. Use of AI among training organizations jumped from 25% to 37% in a year. Organizations are also using AI to personalize learning paths, recommend content and adjust training based on employee needs. For a deeper look at how this shift is changing workplace learning, see our guide to AI trends in workplace learning.
1. AI-Powered and Personalized Learning
AI now sits inside the learning workflow as well as the curriculum. Use of AI among training organizations jumped from 25% to 37% in a year.
Typical uses include:
- Adaptive pathways that change what a learner sees based on prior answers.
- AI recommendations that suggest the next course or resource.
- AI-generated content for first drafts of scenarios, quizzes and job aids.
- AI feedback on written or spoken practice.
- AI coaching that answers questions at the moment.
Speed is the main draw, but drafts still need a human subject-matter expert. AI hours remain small, at 2% of total training hours, so most of the value today is in building and personalizing training, not delivering it.
2. Skills-Based Learning Is Replacing Role-Only Training
Job titles are a poor guide to what people can actually do. Skills-based approaches start from a skills taxonomy (a shared list of skills), build a skills inventory (who has what), measure skill proficiency and use that data for workforce planning.
Adoption is broad in name. TalentLMS found that 79% of HR managers say their company is adopting a skills-based approach to hiring, training and career development. That is a vendor survey and reflects intent, so the real depth of adoption is probably lower.
3. Learning Is Moving Into the Flow of Work
Employees rarely have a free afternoon for a course. Training that appears at the moment of need has a better chance of being used.
This covers microlearning, job aids, contextual support, just-in-time learning and performance support tools. Microlearning modules are usually under 20 minutes and built around a single learning objective, per Wikipedia’s overview of the technique. Short does not mean shallow, but it does mean it works better for reinforcement than for teaching complex skills from scratch.
4. AI Training Is Becoming a Core L&D Requirement
L&D teams now have two AI jobs. They use AI to build training, and they train employees to use AI safely. The second job covers:
- AI literacy: what AI can and cannot do.
- Generative AI basics for common work tasks.
- Prompting: writing clear instructions and checking results.
- Workflow integration: where AI fits in a specific role.
- Responsible AI use, including security and governance rules.
The gap between use and preparation is wide. Gallup’s data shows 52% of U.S. employees now use AI at work, while a Study.com survey found about 35% of employees have never received AI training of any kind.
5. Reskilling and Upskilling Are Becoming Strategic
These are no longer side projects run by HR. Skill gaps are the barrier to business transformation that employers cite most, with 63% naming them, and 85% plan to prioritize upskilling. A later section covers how to choose between the two.
6. Leadership Development Is Becoming More Context-Specific
Generic leadership workshops are losing ground to programs built around a specific situation: a first-time manager, a leader managing hybrid teams, an executive leading an AI rollout. Leadership training is the most common career-development practice, offered by 71% of organizations, so the differentiator now is fit, not availability.
7. Coaching and Mentoring Are Becoming More Important
Courses teach concepts, while coaching helps people apply them. Coaching and mentoring purchases held steady, with 28% of organizations planning to buy them. Coaching does not scale as cheaply as content, which is why many organizations pair it with manager enablement.
8. Training Is Shifting From Content to Practice
People learn conversations, decisions and procedures by practicing them. Simulations, role-play, AI role-play and scenario-based learning all give people safe repetition.
Games and simulations top the 2026 purchase list at 49%, up from 46% the year before. That is a buying-intent number, not proof of results, but it shows where budgets are heading.
9. L&D Is Moving From Course Delivery to Performance Consulting
Performance consulting means starting with the business problem instead of the training request. If sales conversion is slipping, the cause might be a broken CRM workflow, unclear pricing rules or a hiring problem. Training only fixes a skill or knowledge gap.
Training providers report that 58% saw customer expectations rise for training that produces business outcomes. Buyers are asking harder questions.
10. Training Measurement Is Moving Toward Business Outcomes
Completion rates are giving way to performance metrics. The gap is still large, though. Fewer than a quarter of organizations measure whether training meets organizational goals, and fewer still measure ROI. Anyone who can show a link between a program and a business result has a real advantage in the next budget cycle.
AI and Corporate Training Statistics for 2026
How quickly is AI training growing?
Twenty-five percent of organizations expect to increase funding for AI training, second only to management training at 30%. In practice, AI is already the fastest-rising line item in many budgets.
How many employees are receiving AI training?
Reliable, nationally representative figures on this are thin. The best-known data comes from vendor surveys. Study.com reports about 35% of employees have received no AI training, and among those who were trained, only 18% say it prepared them to work independently. I’d treat this as a directional signal and confirm it against your own employee survey.
AI adoption vs AI training
Adoption is running ahead of preparation. Gallup’s Q2 2026 data shows 47% of U.S. employees say their organization has integrated AI tools, up from 41% a quarter earlier, while 20% aren’t sure whether their employer has adopted AI at all.
That uncertainty is a training problem. If one in five people can’t tell whether AI is sanctioned, they either avoid it or use it without guardrails.
Which AI skills should employees learn?
Start with role-specific skills. An administrative assistant needs practical drafting, summarizing and checking habits. An engineer needs to understand how to build, test and monitor AI-enabled systems.
LinkedIn’s 2025 report makes the same point, noting that administrative assistants benefit from introductory generative AI fluency while engineers need highly technical skills. A single company-wide AI course rarely fits both.
How companies are using AI in L&D
Common uses are content drafting, personalized recommendations, skills mapping and learner support. LinkedIn found 71% of L&D professionals are exploring, experimenting with or integrating AI into their work.
There is one warning sign. TalentLMS found 47% of leaders say AI training is built to automate jobs, which suggests many organizations train for automation rather than augmentation. How you frame the training affects how employees respond to it.
The biggest AI training gaps
Three gaps show up repeatedly:
- Access without guidance. People have the tools but no clear rules.
- Training that doesn’t transfer. Generic courses don’t change daily work.
- Weak managers. Only about 1 in 4 HR professionals played a leading role in their organization’s AI implementation, even though two-thirds believe HR should lead AI change management and training.
Breadth matters too. Gallup’s Q2 2026 data, as summarized by AGORA Intelligence, reports productivity gains rise from 45% among narrow AI users to 90% among those who apply AI to seven or more task types. People who only use AI for one task capture a fraction of the benefit, which is a training opportunity.
AI training risks
Every AI training program should cover the risks, not just the benefits:
- Data privacy: what must never be pasted into a public tool.
- Hallucinations: AI can state false things with confidence, so outputs need checking.
- Bias: outputs can reflect skewed training data.
- Security: prompt injection, leaked credentials and unapproved tools.
- Governance: who approves tools and use cases.
- Over-reliance on automation: people stop checking work they should still own.
Regulation is part of the picture for anyone operating in Europe. Article 4 of the EU AI Act took effect on 2 February 2025 and was later amended by the Digital Omnibus on AI, in force from mid-July 2026. The amended text requires providers and deployers to support the development of AI literacy among their staff and does not require a guaranteed literacy level for any individual. The duty remains, so keep a record of what you provide. I’m not a lawyer, so check the current text with counsel.
Corporate Training and the Skills Gap
How large is the workforce skills gap?
It is large enough that employers rank it first among barriers. If the world’s workforce were 100 people, 59 would need training by 2030, and 11 of those would be unlikely to receive it. The World Economic Forum translates that to over 120 million workers at medium-term risk of redundancy.
The pace may be easing slightly. The share of skills expected to change fell from 44% in the 2023 edition to 39%, which the report links to more workers (50%) having completed training. Training seems to be working, but a 39% shift is still huge.
Which skills are changing fastest?
Technology skills are growing quickest. The WEF expects demand for AI, big data and cybersecurity skills to grow fastest. Analytical thinking remains the most sought-after core skill, with seven out of ten companies considering it essential.
Technical skills vs human skills
You need both. The WEF says human skills such as resilience, flexibility, agility, leadership and collaboration remain critical alongside the technical ones, and many growing jobs will require a mix.
A support agent who learns an AI tool but can’t handle an upset customer isn’t better prepared. The same goes for the reverse.
Upskilling vs reskilling
Upskilling means deepening or updating skills for someone’s current role. Reskilling means training someone for a different role. Wikipedia’s entry on retraining covers the broader definition and the evidence on worker retraining.
The WEF split shows how employers see the balance. Of the 59 who need training, employers expect 29 to be upskilled in their current roles and 19 to be upskilled and redeployed elsewhere in the company.
Skills-based workforce planning
Skills-based planning starts by asking what capabilities the business needs in 12 to 24 months, comparing that to what people can do today, and closing the gap through training, internal moves or hiring. It only works if the skills data is honest and current. A skills inventory built once and left alone goes stale within a year.
What the skills gap means for corporate training budgets
Budgets will keep flowing toward priority skills, and spending will need to be more targeted. The top 2026 priority for training resources is making programs more effective, cited by 28% of organizations. In practice, that means fewer generic courses and more programs tied to a named skill gap.
Corporate Training and Employee Retention
Does training improve employee retention?
Training can support retention, but the evidence is mostly correlational. LinkedIn reports 88% of organizations are concerned about retention and rank providing learning opportunities as their top retention strategy. That tells you what organizations believe works. It doesn’t prove causation.
The stronger claim is narrower: people leave when they can’t see a future at the company, and visible development is one way to show them one.
Career development and retention
LinkedIn separates organizations by how mature their career development programs are. Only 36% qualify as “career development champions” with robust programs in place. You can see the full framework in LinkedIn’s Workplace Learning Report.
Internal mobility and employee development
Internal mobility is where development becomes visible. The gap between offering and delivering is telling: 71% of organizations offer leadership training, but only 26% offer job rotations. Rotations take coordination and manager buy-in, which is why fewer companies run them.
Why training alone does not guarantee retention
Someone can complete every course and still leave because of pay, a poor manager or no promotion path. Half of organizations say managers lack the support to facilitate career development. Training that ends without a next step often raises expectations the company can’t meet.
What HR should measure
Track retention by cohort instead of company-wide. Compare 12-month retention for people who completed a development program against similar people who didn’t, controlling for role and tenure. Add internal promotion and transfer rates, and ask exit interview questions about growth. Even a simple comparison beats a survey of whether people enjoyed the course.
Leadership and Manager Training Statistics
How common is leadership training?
It is the most common career-development practice. Seventy-one percent of organizations offer it. Management and supervisory training is also the most likely area to receive more funding, at 30% of organizations, and it shares the largest slice of the average budget at 13%.
Why manager development matters
Gallup estimates managers account for at least 70% of the variance in engagement scores across business units. That figure comes from Gallup’s State of the American Manager analysis and is often quoted without its 2015 date. It describes why teams differ from one another, not how any individual employee feels.
Even so, the direction is consistent: two teams in the same company can have very different experiences because of who leads them.
First-time manager training
New managers usually start with the least support. A useful first-time manager program covers feedback conversations, delegation, setting expectations and handling underperformance, and it spreads over several months. A one-day workshop rarely does the job because new managers only understand the problems after they’ve faced them.
AI readiness for managers
Managers set the rules for daily AI use in their teams. If they don’t understand what’s allowed, employees won’t either. Give managers a short, specific playbook: approved tools, examples of good use, what to check before trusting an output, and how to talk to people worried about their jobs.
Leadership training vs leadership coaching
Training gives leaders shared frameworks. Coaching applies them to a specific situation with one-to-one feedback. Training scales and coaching personalizes, so many companies use training for the whole group and coaching for high-stakes transitions.
Corporate Training Formats: What Is Growing in 2026?
No single format wins. The right one depends on the problem, as the table shows.
| Training format | Best for | Advantages | Limitations |
| Instructor-led | Complex skills | Interaction, live feedback | Time and cost |
| E-learning | Knowledge | Scale, consistency | Engagement drops without practice |
| Microlearning | Reinforcement | Convenient, quick | Limited depth |
| Coaching | Leadership and behavior | Personalization | Hard to scale |
| Simulation | Practice | Safe repetition | Build cost |
| AI learning | Personalization | Adaptive, fast to produce | Governance and accuracy checks |
Instructor-led training hasn’t disappeared. Classroom delivery held 28% of training hours in 2025, and more companies plan to increase in-person training (15%) than remote (13%). Practitioner communities regularly debate this balance, and the common thread is that the format matters less than whether the design fits the skill being taught.
Corporate Training Effectiveness Statistics
Why completion rates are not enough
Completion tells you someone reached the end. It doesn’t tell you they learned, changed behavior or improved a result. Leaders who report on completion alone get stuck defending activity instead of outcomes. That is why it is important to understand how to measure training effectiveness in the workplace using learning, performance and business outcome metrics.
Training activity vs learning
A person can click through a module while doing other work. Add a check that requires application: a scenario decision, a short practice task or a manager observation.
Learning vs behavior change
The Kirkpatrick model separates these clearly. Its four levels are reaction, learning, behavior and results. Many programs stop at level two. Behavior change is where the value is, and it is where most measurement falls short.
Training transfer
Transfer means people use the training on the job. It rises when managers reinforce the skills, when the workplace allows people to apply them and when practice follows the learning soon after. A skill taught in March and never revisited will fade by summer.
Time to proficiency
Track how long it takes a new hire or a newly trained employee to reach a defined performance level. Shortening it is one of the cleanest ways to show impact because finance teams understand time saved.
Business performance
Link the program to one metric the business already tracks, such as error rates, sales cycle time, safety incidents or customer satisfaction. Choose the metric before designing the training, not after.
The Most Important Corporate Training KPIs for 2026
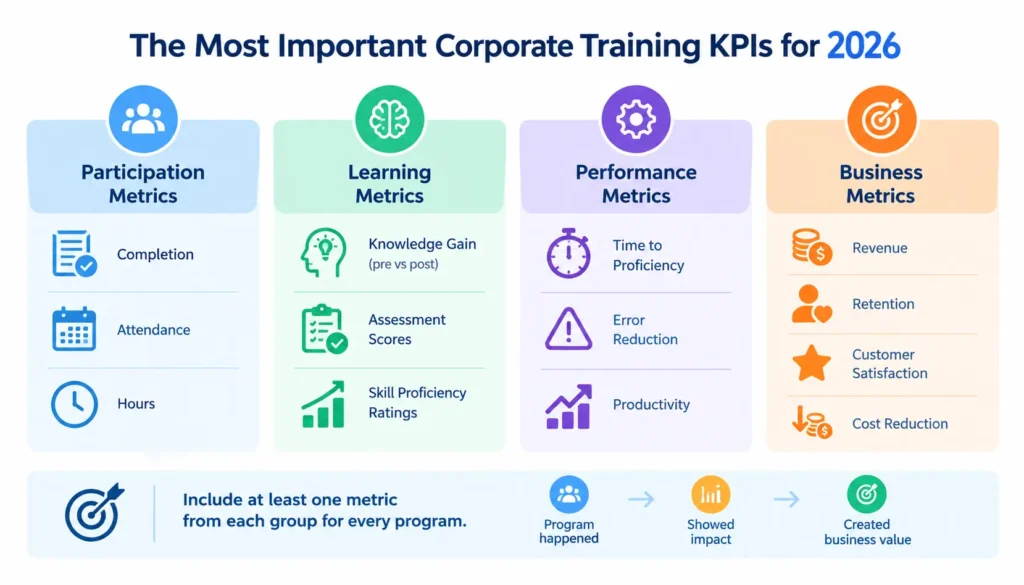
Use metrics from all four groups. Measuring only participation makes L&D look like a cost center.
Training participation metrics show reach: completion, attendance and hours. They are easy to collect and the least persuasive.
Learning metrics show whether knowledge or skill changed: knowledge gain (pre versus post), assessment scores and skill proficiency ratings.
Performance metrics show whether people work differently: time to proficiency, error reduction and productivity. These measures help connect training to what employees actually do after learning, rather than stopping at course completion. For practical ways to connect training with employee output, see our guide to ways to increase workforce productivity through training.
Business metrics show company-level results: revenue, retention, customer satisfaction and cost reduction.
A useful rule is to report at least one metric from each group for every major program. Participation shows the program happened, and the business metric shows it mattered.
How to Calculate Corporate Training ROI
Corporate training ROI formula
Jack Phillips proposed adding a fifth evaluation level to the Kirkpatrick model, comparing the fourth level’s results to the total cost of training. The formula:
ROI (%) = (Program benefits − Program costs) ÷ Program costs × 100
You can also express it as a benefit-cost ratio: benefits ÷ costs.
What counts as training cost?
Count everything, not just the vendor invoice:
- Design, licensing or vendor fees
- Facilitator and platform costs
- Participants’ paid time away from work
- Manager and mentor time
- HR and IT administration
- Travel, materials and equipment
Skipping paid time and manager time is the most common way to understate cost.
What counts as a training benefit?
Benefits are the measurable business results, converted to money: reduced errors, faster onboarding, fewer safety incidents, lower turnover or higher sales. Isolate the training’s share. If several things changed at once, attribute only a portion of the improvement to training.
Worked example
This is a hypothetical example for illustration.
A 100-person customer support team completes a six-week quality program.
- Vendor fees: $70,000
- Participant paid time (100 people × 12 hours × $40 loaded hourly cost): $48,000
- Manager time: $12,000
- Administration and technology: $10,000
- Total cost: $140,000
Over the next 12 months, rework and error costs drop by $280,000. Through manager estimates and a comparison with a team that didn’t take the program, you attribute 70% of that improvement to training.
- Attributed benefit: $196,000
- Net benefit: $196,000 − $140,000 = $56,000
- ROI: $56,000 ÷ $140,000 × 100 = 40%
- Benefit-cost ratio: 1.4
Common ROI measurement mistakes
- Counting only the invoice. Paid time and manager time are real costs.
- Claiming all of the improvement. Other factors affect results.
- Measuring too soon. Behavior change takes months to show up.
- Skipping the baseline. Without a starting number, there is nothing to compare.
- Forcing ROI on everything. Use full ROI analysis for expensive, strategic programs. Use lighter measures for the rest.
There is no reliable universal “average ROI of corporate training.” Any single number you see quoted usually comes from a vendor’s own customers.
How Corporate Training Statistics Differ by Company Size
Small businesses
Small companies spend the most per learner and have the smallest budgets. Small companies averaged $1,091 per learner against $468 for large ones. They also lean on external vendors more, since they can’t build content in-house. Remember the survey covers organizations with 100 or more employees, so very small businesses are not represented.
Midsize companies
Midsize firms are the most exposed to budget pressure. They showed the highest share of decreased budgets, at 23%, against 12% for small companies and 13% for large ones. They are also the heaviest LMS users: 97% of midsize companies use one, against 90% of large and 84% of small.
Large enterprises
Large enterprises have the biggest total budgets but spread them thinly. Their average budget fell from $13.3 million to $11.7 million in 2025. They also have the most complex problems: consistency across regions, compliance at scale and skills data across many roles.
Why one training benchmark cannot fit every company
Company size changes cost per learner, delivery mix, staffing and priorities. ATD advises using its data to benchmark your own trends over time and to focus on your industry and organization size instead of trying to replicate the average. That is good advice for any benchmark.
U.S. vs Global Corporate Training Statistics
The U.S. and global figures come from different surveys with different populations, so put them side by side with care.
| Metric | U.S. | Global | Source and year |
| Total training spending | $102.8 billion (employer spend) | $427.3 billion market revenue in 2025 | Training Magazine 2025; Grand View Research 2026 |
| Regional share of market | North America 37.8%, U.S. the largest country market | Global total above | Grand View, 2025 |
| Skills expected to change | Not reported separately here | 39% by 2030 | WEF, 2025 |
| Skills gaps as a barrier | Not reported separately here | 63% of employers | WEF, 2025 |
| Retention concern | Not reported separately here | 88% of organizations | LinkedIn, 2025 |
| AI use at work | 52% of employees | No comparable global figure used here | Gallup, Q2 2026 |
Do not divide the U.S. total by the global market size to get a “U.S. share.” One measures what employers spend and the other measures what vendors earn. Also avoid mixing an ATD per-employee figure with a Training Magazine per-learner figure, or comparing a U.S. survey of organizations with 100+ employees against a global survey of employers.
How to Use Corporate Training Statistics in an HR or L&D Business Case
Step 1 — Identify the business problem
Start with a problem in business terms: “Time to first sale for new reps is 14 weeks,” not “we need sales training.”
Step 2 — Select the right benchmark
Choose a benchmark that matches your size, industry and geography. If you quote spend, state whether it’s per learner or per employee. Use the same wording as the source.
Step 3 — Establish your baseline
Measure where you are today: current performance, current spend and current hours. Without this, no result can be attributed to training.
Step 4 — Set measurable outcomes
Write a specific target with a date. “Reduce time to proficiency from 14 to 10 weeks within two quarters” is testable. “Improve skills” is not.
Step 5 — Choose the training intervention
Match the format to the problem. The decision framework in the next section helps here.
Step 6 — Measure learning and performance
Collect data at several points: right after training, at 30 to 60 days and at 90 days or later. Pair learning data with performance data.
Step 7 — Report business impact
Present results in the language of finance and operations. Show costs, results, the share you attribute to training and the limits of your estimate. A modest, honest number is more persuasive than an inflated one.
How to Choose the Right Corporate Training Strategy for 2026
Start with the problem, not the format:
| If the problem is… | Then consider… |
| Knowledge | Digital learning |
| Practice | Simulation or coaching |
| Changing skills | Reskilling or upskilling |
| Leadership | Coaching plus contextual training |
| AI adoption | Role-specific AI training plus manager enablement |
| Performance | Diagnose the business or process issue before creating training |
The last row saves the most money. If people know what to do but the process makes it hard, training won’t fix it. Check for unclear expectations, broken tools, missing incentives and poor management before commissioning a course.
Corporate Training Statistics by Category
This reference table gathers the most useful figures. Bookmark it, and check the source before using any figure in a formal document.
| Statistic | Figure | Year | Population | Geography | Source | What it means |
| Total spend | $102.8B | 2025 | Orgs with 100+ employees | U.S. | Training Magazine | Spending rebounded |
| Per learner | $874 | 2025 | Same | U.S. | Training Magazine | Counts learners, not headcount |
| Per employee (direct) | $846 | 2025 | 340 orgs | Participating orgs | ATD | Different denominator |
| Hours | 40 vs 16.7 | 2025 | Separate samples | U.S. / participating | Training / ATD | Definitions differ |
| Compliance and management share | 13% each of budget | 2025 | Orgs with 100+ | U.S. | Training Magazine | Largest budget lines |
| Increased funding areas | Management 30%, AI 25% | 2025 | Same | U.S. | Training Magazine | Direction of budgets |
| AI in training | 37% use AI | 2025 | Same | U.S. | Training Magazine | Fast growth from 25% |
| Skills disruption | 39% | By 2030 | Employers | Global | WEF | Sustained change |
| Skills gap barrier | 63% | By 2030 | Employers | Global | WEF | Top barrier |
| Employee AI use | 52% | Q2 2026 | Employed adults | U.S. | Gallup | First time above half |
| Organizations with AI integrated | 47% | Q2 2026 | Employed adults | U.S. | Gallup | Employees often unsure |
| Retention concern | 88% | 2025 | L&D professionals | Global | Learning ranked first | |
| Career development champions | 36% | 2025 | Same | Global | Most orgs lag | |
| Measuring org goals | Under 25% | 2025 | 340 orgs | Participating orgs | ATD | Measurement gap |
| Market size | $458.7B | 2026 | Vendor revenue | Global | Grand View | Not employer spend |
Corporate Training Statistics Methodology
How statistics were selected
I selected figures that met three tests: a named publisher, a stated year and a clear population. I favored annual benchmark reports and primary research from bodies such as Training Magazine, ATD, the World Economic Forum, Gallup and LinkedIn.
How sources were evaluated
Primary publishers came first, market research firms second and vendor surveys third. I flagged vendor surveys such as Study.com as directional. Where aggregator sites repeated a statistic, I traced it to its origin or dropped it. One example: ATD’s 2025 press release printed $1,054 for 2024 per-employee spend, while the full report figure, cited by others, is $1,254. I used the latter.
Why different statistics cannot always be compared
Surveys differ in scope, wording and sample. Training Magazine reports per-learner spending from U.S. organizations with 100 or more employees. ATD reports per-employee direct expenditure from a sample of 340 organizations. Market research firms report vendor revenue, which is a different thing entirely.
Data-year and publication-year differences
Reports are published after the year they measure. Training Magazine surveyed in April to July 2025 and published in November 2025. ATD’s 2026 report reflects 2025 data. Gallup’s AI series is quarterly, and I used the Q2 2026 release. WEF’s outlook covers 2025 to 2030.
U.S. vs global data
Most spend and hours figures here are U.S.-specific or from participating organizations. Skills and retention figures are global. The comparison table marks where data isn’t available, instead of filling gaps with estimates.
Frequently Asked Questions About Corporate Training Statistics and Trends
1. What are the biggest corporate training trends in 2026?
The biggest trends are AI-powered personalization, skills-based learning, training built into daily work, AI literacy programs, reskilling, context-specific leadership development, coaching, practice-based learning, performance consulting and outcome-based measurement. AI shows up in nearly all of them.
2. How much do companies spend on employee training?
U.S. organizations with 100+ employees spent $102.8 billion in 2025, averaging $874 per learner. ATD reports $846 in direct spend per employee. The figures differ because they use different denominators and samples.
3. How many hours of training does an employee receive?
Training Magazine reports 40 hours a year in the U.S. ATD reports 16.7 formal learning hours. The gap reflects different samples and definitions, so use one source consistently.
4. How is AI changing corporate training?
AI speeds up content creation, personalizes learning paths and supports coaching. It also creates a new training need: teaching employees to use AI safely. The share of training organizations using AI rose from 25% to 37% in a year.
5. What percentage of employees need reskilling?
The World Economic Forum estimates 59 of every 100 workers will need training by 2030. That figure covers both upskilling and reskilling and applies globally.
6. What skills are most important in 2026?
Analytical thinking ranks first with employers. AI, big data and cybersecurity skills are growing fastest, while resilience, flexibility, leadership and collaboration remain critical.
7. What is the difference between upskilling and reskilling?
Upskilling improves skills for someone’s current role. Reskilling prepares someone for a different role. Employers usually need both, and the WEF expects them to be used in roughly comparable numbers.
8. Does corporate training improve employee retention?
It can help, but the evidence is correlational. Organizations rank learning opportunities as their top retention strategy. Pay, management quality and career paths also affect whether people stay.
9. What is the average ROI of corporate training?
There is no reliable universal average. ROI depends on the program, the cost accounting and how much improvement you attribute to training. Use the formula in this article on your own data, and be skeptical of vendor-supplied averages.
10. How should companies measure training effectiveness?
Measure at four levels: participation, learning, on-the-job performance and business results. The Kirkpatrick model uses reaction, learning, behavior and results. Set a baseline before training starts.
11. Is instructor-led training still relevant?
Yes. Classroom delivery accounted for 28% of training hours in 2025, and management training is expected to see the largest increase in in-person delivery (24%). It suits complex skills that need live interaction and feedback.
12. What is the future of corporate training?
Expect training to become more personalized, more embedded in work and more tied to business outcomes. L&D teams will spend less time delivering courses and more time diagnosing performance problems, guiding managers and measuring results.
Conclusion
The most useful corporate training statistics this year point in the same direction. Spending is up, hours are uneven, skills are changing and AI is spreading faster than the training that should accompany it.
Use the numbers carefully. Match the benchmark to your company size and geography, keep denominators straight and measure results beyond attendance. If you do one thing next quarter, pick one program, set a baseline and track a single business metric through to the end.