


Most employee training statistics get quoted without a year, a sample or a source. That is how a 2023 figure ends up in a 2026 budget deck.
This guide takes a stricter approach. Every number below has a named source and a year. Where public data is thin, I say so instead of filling the gap with a nice-sounding percentage.
Why Employee Training Data Matters in 2026
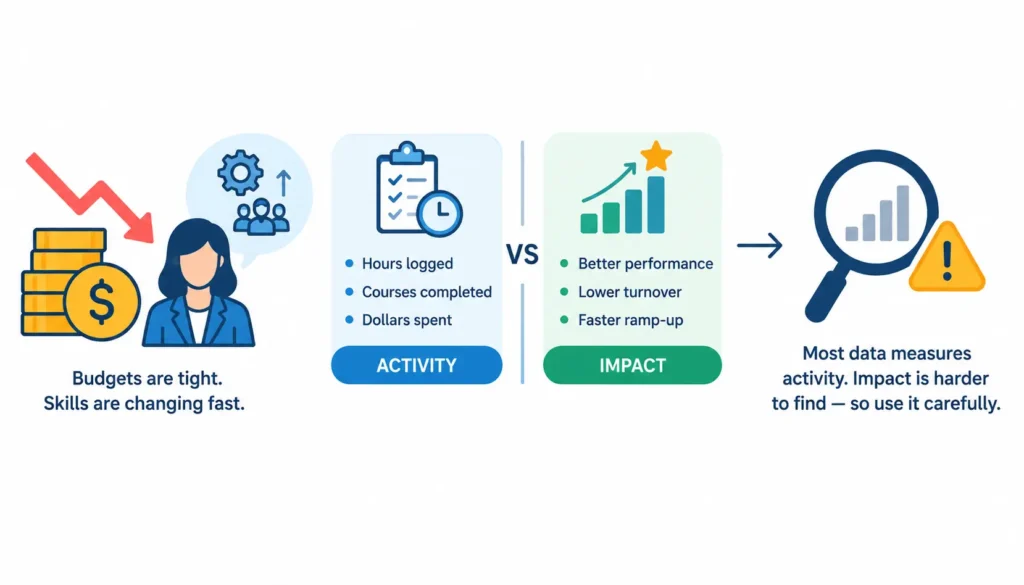
Training budgets are under pressure while skills are changing faster than most job descriptions. HR leaders need numbers to defend their programs, but weak numbers do more harm than none.
There is also a difference between training activity and training impact. Activity is hours logged, courses completed and dollars spent. Impact is better performance, lower turnover and faster ramp-up. Most benchmark data measures activity. Impact is harder to find, so treat it with more care.
Read these numbers with three cautions:
- Statistics come from different populations. A survey of 340 mostly U.S. organizations is not the same as a global employer survey.
- They cover different years. A 2025 figure and a 2023 figure are not interchangeable.
- They use different definitions. “Per employee” and “per learner” can differ by 40% or more.
I picked each statistic for source quality, recency and usefulness to an HR decision. Sources are primary where possible, such as ATD, the World Economic Forum, Gallup and LinkedIn. Secondary summaries are flagged.
Employee Training Statistics at a Glance
The Most Important Employee Training Statistics
| Metric | Latest figure | Year | What it tells HR |
| Direct spend per employee | $846 (ATD) | 2025 data | Investment benchmark |
| Spend per learner | $874 (Training Magazine) | 2025 | Budget benchmark (different denominator) |
| Formal learning hours | 16.7 per employee (ATD) | 2025 data | Learning volume |
| Cost per learning hour | $165 (ATD) | 2024 data | Efficiency |
| Orgs measuring ROI | Fewer than a quarter measure goal achievement; fewer still measure ROI (ATD) | 2025 data | Measurement maturity |
| Skills change by 2030 | 39% of core skills (WEF) | 2025 report | Capability risk |
| Workers needing training | 59 of every 100 (WEF) | 2025 report | Scale of upskilling |
| Skills gap as barrier | 63% of employers (WEF) | 2025 report | Business risk |
| Career development “champions” | 36% of organizations (LinkedIn) | 2025 | Retention lever |
| Global engagement | 20% (Gallup) | 2025 data | Employee experience |
| Regular AI users with recent employer AI training | About 1 in 3 (Conference Board) | 2026 | AI readiness |
These are the figures HR leaders ask for most. The sections below explain each one and how to use it.
Employee Training Spending Statistics
How much do companies spend on employee training?
Short answer: ATD’s 2026 report puts average direct learning spend at $846 per employee for 2025, a $408 drop from 2024. Training Magazine’s separate survey found total U.S. training spending rose 4.9% to $102.8 billion.
The two findings can both be true. ATD measures direct spend per employee. Training Magazine covers U.S. organizations with 100 or more employees and reports per learner.
ATD suggests the drop may reflect more virtual instructor-led training (less travel), smaller talent development teams, and automated admin. It may also be a sampling effect. ATD’s 2026 sample was 340 organizations, so sharp year-over-year swings partly reflect who took part.
Average training spend per employee
Here is the recent ATD trend:
| Data year | Direct spend per employee | Formal hours |
| 2023 | $1,283 | 17.4 |
| 2024 | $1,254 | 13.7 |
| 2025 | $846 | 16.7 |
Sources: ATD’s 2024, 2025 and 2026 State of the Industry editions, as compiled by TrainingCost.com. This is a good example of why source-checking matters. ATD’s 2025 press release printed $1,054 for 2024, but the full report value was $1,254. Many pages still repeat the older number.
Also remember that direct spend excludes indirect costs such as the time employees spend away from work. Your true cost is higher.
Training spending by company size
Small businesses. One aggregator reports that small companies spend roughly $1,091 per learner versus about $468 at large enterprises. The logic is scale. A small firm cannot spread content and platform costs across many people. Treat this as directional, since the underlying segmentation is partly paywalled.
Midsize businesses. Public data for midsize firms is thin. Use your closest peers instead of a single average.
Large enterprises. Lower per-head cost usually reflects shared content and platforms. It does not necessarily mean less effective training.
Average training budget by industry
Financial services is commonly reported as the highest spender, at roughly $1,097 per employee. That fits regulated industries with heavy compliance requirements. Again, industry splits are mostly secondary and paywalled. ATD itself advises using industry and organization-size cuts rather than trying to replicate a headline average.
Training staff and technology costs
ATD reports the average cost per learning hour used was $165 in 2024, up 34% from $123 in 2023. Hours fell while cost per hour rose. That points to shorter, more targeted, more expensive-to-build content. It may also mean some learning moved into the flow of work, where it isn’t counted as a formal hour.
What HR leaders should learn from training-spend statistics
Don’t argue “we should spend the average.” Argue “here is what our spend buys.”
- Pick one benchmark and name it, for example “ATD 2026, direct expenditure per employee.”
- Match the denominator. Compare per-employee to per-employee.
- Add indirect costs before comparing.
Employee Training Hours and Frequency Statistics
Average training hours per employee
ATD found employees used 16.7 formal learning hours in 2025, up from 13.7 in 2024. This is formal training only. On-the-job and informal learning are excluded.
How often do companies train employees?
ATD’s 2025 report lists new-employee orientation, mandatory and compliance training, and managerial and supervisory training as the three most common content areas. In practice, most employees get onboarding and compliance, and far fewer get sustained skill development.
How much training do employees want?
I could not find a reliable, recent, vendor-independent figure for the share of employees who want more training. Many pages quote one without a source. The better signal is behavioral. LinkedIn found that only 15% of employees said their manager helped build a career plan in the past six months, down five points. Demand for development is high. Structured support is not.
Training frequency by delivery method
Public benchmarks for delivery-method frequency are mostly paywalled. Track your own mix of instructor-led, virtual, self-paced and on-the-job learning, and compare it year over year.
What is a reasonable training-hour benchmark?
Use 16.7 hours as a reference point, not a target. There is no universal ideal number. A software engineer, a nurse and a warehouse operator need very different amounts of training. Hours also say nothing about quality.
A better question is: “Do our hours match the skills our roles need?”
Employee Training ROI and Business Impact Statistics
What is the ROI of employee training?
No trustworthy universal figure exists. That is partly because most companies don’t measure it. Less than a quarter of organizations measure whether training meets its organizational goals, and an even smaller share measure ROI.
If you see “training delivers 353% ROI” in a headline, check the source. It is usually a vendor case study, not a cross-industry benchmark.
Training and profitability, productivity, performance and revenue
LinkedIn reports that the 36% of organizations it calls career development champions are more profitable and better at retaining talent. That is a useful finding, but it is correlational. Well-run companies probably do both things.
For productivity, performance and revenue, I found no independent, recent, widely accepted benchmark, so I’ve left them out. Use your own data. For a practical framework, see our guide on how to measure training effectiveness in the workplace, which explains how to connect training activity with learning, behavior and job performance.
Why training ROI statistics can be misleading
Correlation vs. causation. Profitable firms can afford more training. That doesn’t prove training caused the profit. See this explainer on correlation and causation.
Vendor vs. independent research. Vendors have a reason to publish flattering numbers. Prefer associations, government bodies and large independent surveys.
Short-term vs. long-term impact. A sales course may lift results in 60 days. A leadership program may take a year to show up in turnover.
Employee Training and Retention Statistics
How does training affect employee retention?
Training helps retention when it’s tied to career progress. Generic compliance modules don’t do much.
LinkedIn’s 2025 Workplace Learning Report states the mechanism plainly. Upskilling, coaching and internal role changes help people feel valued and more likely to stay.
Training and employee turnover
I did not find a clean, current, independent number for “how much training reduces turnover.” Be skeptical of any page that offers one without a study. Instead, measure it yourself: compare 12-month retention for trained and untrained groups, controlling for role and tenure.
Career development and retention
Only 36% of organizations are career development champions, meaning they use several tactics to support growth. LinkedIn also reported that champions deploy 33% more career development practices, and that leadership training is the most common, offered by 71% of organizations.
Internal mobility and employee development
Internal mobility is one of the strongest retention levers, and LinkedIn’s report treats it as a strategic priority. Check the LinkedIn Workplace Learning Report directly for exact tenure comparisons before quoting them.
What retention statistics mean for HR leaders
Skills leave with people. LinkedIn’s analysis found business strategy was the skill most likely to be depleted at companies with high turnover. Retention is a training-cost issue as much as a hiring one.
Employee Engagement and Training Statistics
Does training improve employee engagement?
It can, but engagement depends more on managers than on courses. Gallup reports global engagement fell to 20% in 2025, the lowest since 2020, and manager engagement dropped from 31% in 2022 to 22%. Gallup estimates that in best-practice organizations, 79% of managers are engaged.
Employee attitudes toward workplace learning
Employees increasingly expect employers to help them keep up. Industry analyst Josh Bersin puts it bluntly in LinkedIn’s report: employees are saying they expect help keeping up, and if it doesn’t come, they will go elsewhere.
Training, purpose and employee experience
Training feels valuable when people can see where it leads. A short course tied to a promotion path beats a long course with no destination.
What employees expect from workplace training
Based on the sources above, employees want three things: skills tied to their career, manager support, and time to learn. Only that last one requires a budget.
Employee Skills Gap and Reskilling Statistics
How large is the employee skills gap?
The World Economic Forum’s 2025 Future of Jobs Report is the best global source. Skills gaps were cited by 63% of employers as a main barrier to business transformation. If the global workforce were 100 people, 59 would need reskilling or upskilling by 2030, and 11 of them are unlikely to receive it.
The report draws on over 1,000 employers representing more than 14 million workers across 55 economies. That means it reflects employer views, not worker views.
Which skills are most in demand?
Creative thinking, resilience, flexibility and agility, and curiosity and lifelong learning are expected to keep rising in importance, alongside technology skills.
How quickly are job skills changing?
Employers expect 39% of workers’ core skills to change by 2030, down from 44% in 2023. The peak was 57% in 2020. The WEF notes that 50% of workers have now completed training, up from 41% in 2023, which may explain the slowdown. See the general background on retraining.
Upskilling vs. reskilling statistics
Upskilling deepens skills in a current role. Reskilling prepares someone for a different role. The WEF’s headline of 59 in 100 combines both, so don’t quote it as “reskilling” alone.
Career development and skills development
Skills training works best when it is linked to a next step. LinkedIn found 49% of talent and learning professionals say their executives worry employees lack the skills to execute strategy.
What the skills data means for HR workforce planning
Map your critical roles to the skills you expect to change. Then decide, role by role, whether to build, buy or borrow that skill.
AI and Employee Training Statistics
How quickly is AI training growing?
In ATD’s 2025 report, 55% of respondents said their organization offered AI technical skills training in 2024, and 64% expected to increase it. For AI practical skills, 55% offered training and 62% expected to increase it.
How many employees receive formal AI training?
Fewer than use AI. A 2026 Conference Board survey of nearly 1,300 workers found that 55% regularly use AI, but only 1 in 3 took part in employer-provided AI training in the past six months.
AI skills employees need
AI literacy. Understand what AI can and can’t do.
Generative AI tools. Hands-on practice with approved tools.
Prompting and workflow skills. Use AI inside real tasks, not demos.
AI security and responsible use. Know what data should never go into public tools.
AI governance. Managers and leaders need to know policy, accountability and review steps.
How companies are using AI in L&D
Common uses include faster content creation, personalized learning paths and skills-gap analysis. Public, vendor-independent evidence of improved learning outcomes is still limited. Be cautious about claims that AI-built training performs better. Speed is easy to show. Learning gains are harder. For a broader look at where these technologies are heading, see our guide to the future of AI in learning and development
AI training gaps and governance risks
Gallup’s 2026 work suggests managers are a weak link. Less than 1 in 3 employees strongly agree their manager actively supports AI use. Gallup also found manager-led adoption is one of the top drivers of frequent AI use.
The Conference Board’s researcher warned that AI literacy alone will not create business value.
What HR leaders should measure in AI training
- Share of AI users who completed role-specific training
- Policy-compliance incidents
- Time saved on defined tasks
- Manager confidence in supporting AI use
Employee Learning Preferences Statistics
I found no recent, independent, cross-industry dataset with reliable percentages for online vs. in-person, mobile learning or microlearning, and I won’t invent one. Here is what to do instead.
- Online vs. in-person and self-paced vs. instructor-led: Use both. Self-paced suits knowledge. Instructor-led or cohort formats suit skills that need practice and feedback.
- Mobile learning and microlearning: Best for frontline or time-poor staff. See background on microlearning.
- Just-in-time and in-the-flow learning: Short job aids at the moment of need.
- Personalized learning: Worth it where role paths differ widely.
To find out what your employees actually want, run a short pulse survey and compare it to completion data by format. Practitioner discussions on communities are useful for anecdotes, but they are not data.
Leadership Training Statistics
How common is leadership training?
Very. LinkedIn found leadership training is the most common career development initiative, offered by 71% of organizations. ATD lists managerial and supervisory training among the three most common training areas.
Manager training, first-time managers and needed skills
Manager engagement is falling, so manager development matters more. Recall that manager engagement dropped from 31% in 2022 to 22% in 2025. And only 15% of employees say their manager helped them build a career plan.
First-time managers are most exposed. Focus early training on coaching conversations, feedback and setting expectations.
Why manager development belongs in the training strategy
Managers deliver most of what employees experience: coaching, career conversations and AI adoption. If they are unsupported, your other training investments lose value.
Compliance Training Statistics
Participation, completion and security training
Compliance is among the most common training types. ATD lists mandatory and compliance training among the top three content areas. I did not find a reliable, current benchmark for completion rates or security-training participation, so set your own targets (many organizations aim for near 100% on mandatory courses).
Why completion alone doesn’t prove compliance readiness
Completing a module proves someone clicked through it. It does not prove they can spot a phishing email or handle a data request. Add scenario-based assessments and track real incidents.
Employee Training Technology Statistics
Reliable public statistics on LMS adoption, learning experience platforms, analytics and AR/VR are mostly behind paywalls, and many web pages quote them without a clear source. To protect accuracy, I’ve kept this section practical.
How HR leaders should evaluate training technology
- LMS: Does it handle assignment, tracking and reporting at your scale? See the definition of a learning management system.
- Learning experience platforms: Useful mainly if people have real choice in what they learn.
- Learning analytics: Can it connect learning data to performance or retention data?
- Mobile and AI features: Ask for evidence of outcomes, not just demos.
- AR/VR and immersive: Consider for high-risk, hands-on tasks where practice is expensive or unsafe.
Employee Training Effectiveness Statistics
Effectiveness is where most organizations fall short. Only a minority track it, as ATD’s findings show.
A useful frame is the Kirkpatrick model: reaction, learning, behavior and results.
- Completion rate: Participation, not learning.
- Knowledge retention: Test again 30 to 90 days later.
- Skill improvement: Compare pre- and post-assessments.
- Behavior change: Ask managers and observe on-the-job.
- Performance improvement: Use existing business metrics.
- Time to proficiency: How long a new hire takes to hit target.
- Training transfer: Whether people apply what they learned.
The Most Important Employee Training KPIs for HR Leaders
| KPI | Formula | What it measures |
| Completion rate | Completed ÷ Enrolled × 100 | Participation |
| Cost per learner | Training cost ÷ Learners | Efficiency |
| Training ROI | Net training benefit ÷ Training cost × 100 | Financial return |
| Knowledge gain | Post-test − Pre-test | Learning |
| Time to proficiency | Time until target performance | Capability |
| Retention impact | Trained vs. untrained retention | Talent impact |
Start with three: cost per learner, knowledge gain and time to proficiency. They are easy to collect and hard to argue with.
How to Benchmark Your Employee Training Program
Compare against industry. Use your sector, not the all-industry average.
Compare against company size. Small firms pay more per head.
Compare against your own history. Your last two years are often the most honest benchmark.
Compare against business outcomes. Link training to a real metric, like error rate or ramp time.
Compare quality, not just volume. Ask whether learners could apply the training.
Build a simple dashboard. Track spend per learner, hours, completion, one outcome KPI and one retention measure. Review it quarterly.
How to Calculate Employee Training ROI
Basic training ROI formula
ROI (%) = (Net benefit ÷ Training cost) × 100
Net benefit is total benefit minus total cost. This is standard return on investment math.
Worked example (hypothetical)
A company trains 40 customer-support agents. The program costs $60,000 all-in. Six months later, faster handling and fewer escalations save $96,000.
- Net benefit: $96,000 − $60,000 = $36,000
- ROI: $36,000 ÷ $60,000 × 100 = 60%
These numbers are illustrative only. Use your own.
What costs and benefits should be included?
Costs: content or licenses, platform, facilitators, learner time, admin and travel.
Benefits: time saved, fewer errors, lower turnover cost, faster onboarding and higher sales, but only when you can link them to the training.
Common mistakes when calculating training ROI
- Leaving out learner time
- Counting benefits that would have happened anyway
- Using vendor claims instead of your own data
- Measuring too early
What These Employee Training Statistics Mean for HR Leaders
If your training spend is below the benchmark: Check that you are comparing like with like. Then look at outcomes. Lower spend with good results is fine.
If completion is high but performance is low: The content or the follow-up is the problem. Add practice and manager reinforcement.
If employees want more development: Start with career conversations, which cost little. Recall that only 15% report a manager-supported career plan.
If your organization has an AI skills gap: Prioritize role-specific training and manager enablement. Broad AI awareness isn’t enough.
If training isn’t improving retention: Tie it to visible next steps, such as internal roles and stretch projects.
If leadership questions the L&D budget: Bring one business problem, one baseline and one measured result. Numbers about activity won’t persuade a CFO.
How to Use Employee Training Statistics in an HR Business Case
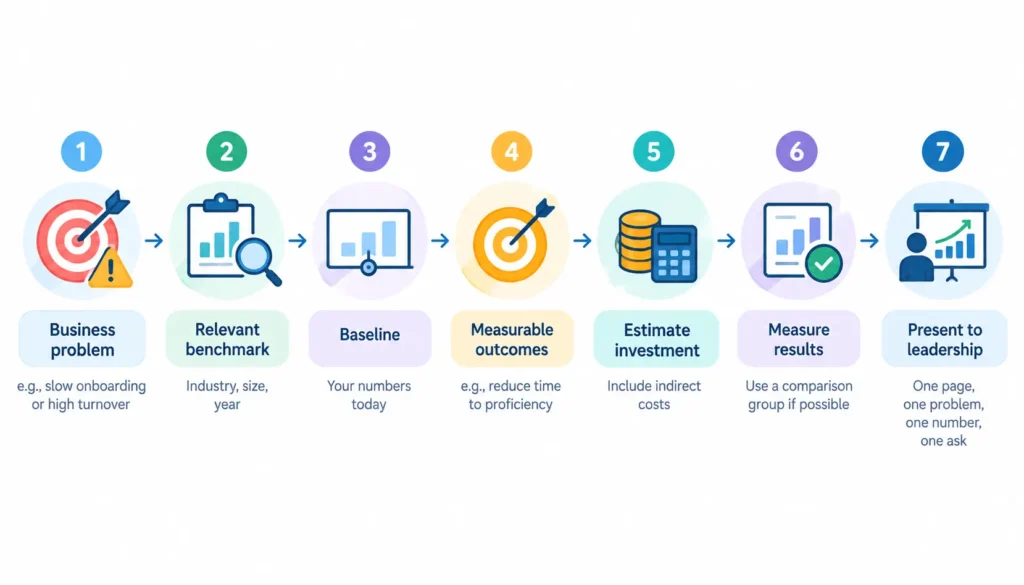
- Start with the business problem. For example, slow onboarding or high turnover in one team.
- Select the relevant benchmark. Match industry, size and year.
- Establish the baseline. What are your numbers today?
- Set measurable outcomes. Example: cut time to proficiency from 90 days to 70.
- Estimate investment. Include indirect costs.
- Measure results. Use a comparison group where you can.
- Present to leadership. One page, one problem, one number, one question.
Employee Training Statistics by Category
| Statistic | Figure | Year | Population | Geography | Source | Why it matters |
| Direct learning spend per employee | $846 | 2025 data | 340 organizations | Primarily U.S. | ATD 2026 State of the Industry | Budget benchmark |
| Formal learning hours per employee | 16.7 | 2025 data | Same | Primarily U.S. | ATD 2026 | Volume benchmark |
| Cost per learning hour | $165 | 2024 data | ATD sample | Primarily U.S. | ATD 2025 | Efficiency |
| Spend per learner | $874 | 2025 | U.S. orgs with 100+ employees | U.S. | Training Magazine 2025 (via Unicorn Labs) | Alternative benchmark |
| Total U.S. training spend | $102.8 billion | 2025 | Same | U.S. | Training Magazine (via Unicorn Labs) | Market size |
| Skills expected to change | 39% | By 2030 | 1,000+ employers | Global | WEF Future of Jobs 2025 | Skills risk |
| Workers needing training | 59 of 100 | By 2030 | Same | Global | WEF 2025 | Scale |
| Employers citing skills gap as barrier | 63% | 2025 | Same | Global | WEF 2025 | Business risk |
| Career development champions | 36% | 2025 | L&D professionals | Global | LinkedIn WLR 2025 | Retention lever |
| Employees with manager-built career plan | 15% | 2025 | LinkedIn survey | Global | LinkedIn WLR 2025 | Manager gap |
| Global employee engagement | 20% | 2025 data | 140,000+ employed respondents | 160+ countries | Gallup 2026 | Experience |
| Manager engagement | 22% | 2025 | Managers | Global | Gallup 2026 | Manager risk |
| Regular AI users with recent employer AI training | About 1 in 3 | 2026 | ~1,300 workers | U.S. | Conference Board via ESG Dive | AI readiness |
| Orgs offering AI technical training | 55% | 2024 data | ATD sample | Primarily U.S. | ATD 2025 | AI adoption |
Frequently Asked Questions About Employee Training Statistics
1. What is the average cost of employee training?
ATD reports $846 in direct learning spend per employee for 2025. Training Magazine reports $874 per learner. Indirect costs are extra.
2. How many hours of training does an employee receive per year?
About 16.7 formal hours in 2025, per ATD. This excludes informal learning.
3. What percentage of companies provide employee training?
No single reliable global figure exists. The WEF reports that 50% of workers had completed training, reskilling or upskilling by 2025. That measures workers, not companies.
4. What is a good employee training completion rate?
There’s no official standard. Many organizations target near 100% for mandatory compliance and lower for optional courses. Compare to your own history.
5. What is the average ROI of employee training?
No credible universal average exists. Few organizations measure ROI at all. Calculate your own using the formula above.
6. Does employee training improve retention?
It can, especially when linked to career growth. LinkedIn found career development champions are better at retaining talent. This is an association, not proof of cause.
7. What percentage of employees want more training?
I couldn’t verify a reliable current figure, so I don’t quote one. Ask your own employees.
8. What are the most important employee training KPIs?
Cost per learner, knowledge gain, time to proficiency, completion rate, retention impact and ROI.
9. How is AI changing employee training?
It speeds content creation and personalization, and it creates a new training need. Only 1 in 3 regular AI users recently received employer-provided AI training.
10. What training statistics should HR leaders track?
Spend per learner, hours, one outcome KPI, one retention measure, and AI-training coverage.
Conclusion
The best employee training statistics tell you where you stand, not what to do. Use ATD for spend and hours, the WEF for skills, Gallup for engagement and LinkedIn for career development. Always check the year, population and definition.
Then measure your own outcomes. That is the one benchmark no report can give you.