


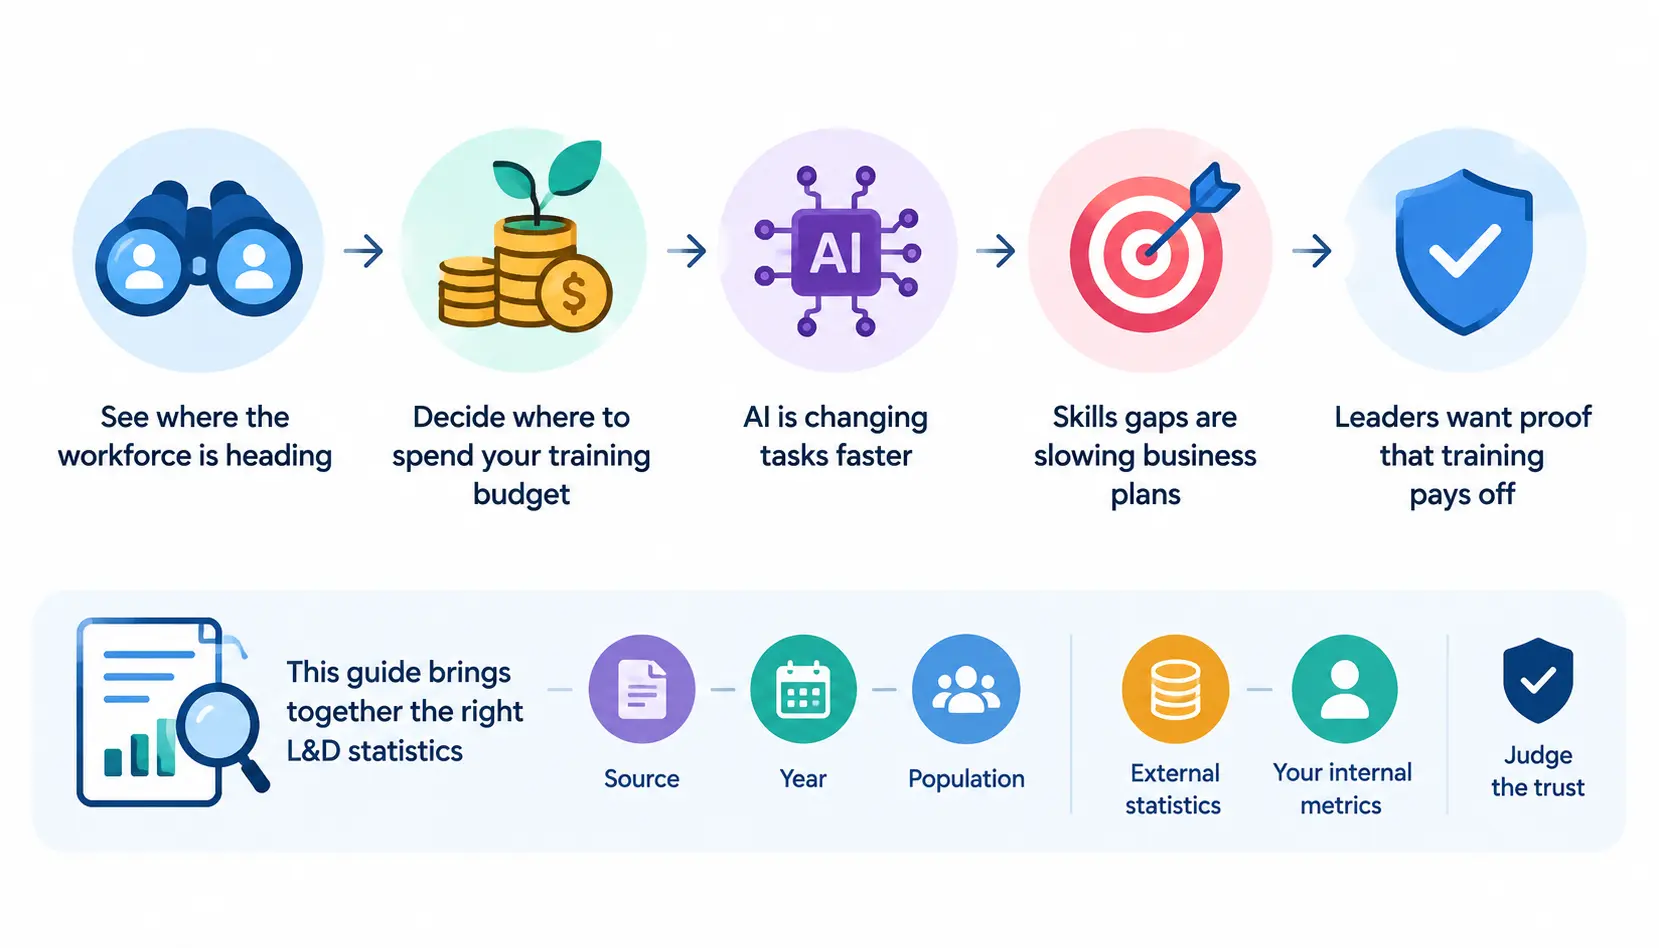
Learning and development statistics help you see where the workforce is heading and decide where to spend your training budget. In 2026, that job is harder than it was. AI is changing tasks faster than job descriptions can keep up. Skills gaps are slowing business plans, and leaders want proof that training pays off.
This guide pulls together the learning and development statistics worth using, with the source, year and population behind each one. It also separates external statistics from your own internal metrics, and shows you how to judge whether a number deserves your trust.
Key Learning and Development Statistics for 2026
L&D at a Glance
The table below is a quick snapshot. I only included figures I can attach to a named source and year. Where a reliable, current number varies by report edition, I point you to the source to check instead of guessing.
| Area | What the data says | Source, year and population | Context |
| Skills change | Employers expect about 39% of workers’ core skills to change by 2030 | World Economic Forum, Future of Jobs Report 2025; 1,000+ employers across 55 economies | A projection, not an observed result |
| Workforce learning need | Of 100 workers, about 59 will need training by 2030 | Same WEF report | Includes upskilling, redeployment and workers unlikely to get training |
| Upskilling demand | About 85% of employers plan to prioritize upskilling | Same WEF report | Stated intent, not delivered training |
| Skills gaps | About 63% of employers name skills gaps as the top barrier to transformation | Same WEF report | Employer perception |
| Job churn | About 170 million jobs created and 92 million displaced by 2030 | Same WEF report | Net gain of roughly 78 million |
| AI adoption | About half of employers plan to reorient their business around AI | Same WEF report | Planning, not results |
| Career development | Career development maturity links to retention, confidence in profitability and AI adoption | LinkedIn Workplace Learning Report, 2025 | Association, not proof of cause |
| L&D investment | Spend and hours per employee vary by year and organization size | ATD State of the Industry; Training Magazine Training Industry Report | Pull the latest edition |
| Retention | Internal mobility and career growth are linked with longer tenure | LinkedIn Workplace Learning Reports | Correlation |
| Learning engagement, training effectiveness, business impact | Best measured with your own data | Internal LMS, HRIS and performance systems | See the metrics section |
Notice how many of these are projections or intentions. That matters, and I come back to it later.
L&D Statistics on Skills Gaps and Workforce Readiness
How quickly are workplace skills changing?
The World Economic Forum’s Future of Jobs Report 2025 is the best current source for workforce-change projections. It expects roughly 39% of core skills to change by 2030. That is a forecast from employers, so treat it as direction, not a measured fact.
In plain English: about four in ten of the skills your people use today may look different within a few years.
How widespread are organizational skills gaps?
The same report found that about 63% of employers see skills gaps as their biggest barrier to business transformation. That is the most-cited reason plans stall. It also explains why so many L&D teams have moved from course catalogs to skills strategy.
Upskilling statistics
Upskilling means teaching current employees new skills for their current or evolving roles. About 85% of surveyed employers said they plan to prioritize it. Intent is easy to state. Delivery is harder, and most companies still struggle to show what changed after training.
Reskilling statistics
Reskilling means preparing someone for a different role. The WEF estimates that among 100 workers, about 59 will need training by 2030. Of those, roughly 29 could be upskilled in their current roles and about 19 upskilled and redeployed elsewhere. About 11 are unlikely to get the training they need.
Future skills and workforce readiness
Employers in the WEF data put analytical thinking, resilience, flexibility and AI and big data skills near the top of the growth list. Technical skills matter, but so do human ones like curiosity and adaptability. Those are hard to teach in a one-hour module.
What these statistics mean for L&D leaders
Take a mid-sized logistics company that sees these numbers and decides to “train everyone on AI.” That plan is too broad. A better plan maps which roles change first, sets a skill target for each, and starts with the highest-risk groups. A corporate learning and development strategy can help turn those skill priorities into a structured plan.
Use skills statistics to prioritize, not to justify a large, generic program.
AI and Learning & Development Statistics
AI adoption in L&D
L&D teams use AI to draft content, summarize material, build quizzes and personalize learning paths. Adoption figures differ a lot between surveys because each one defines “using AI” differently. One survey counts a team that tried a chatbot once. Another counts only production use. So check the wording before you quote any adoption percentage.
Learn more about AI in Learning and Development and how organizations are using it across modern training programs.
AI skills and AI literacy
AI literacy means understanding what AI tools can and can’t do, and using them safely at work. The WEF report places AI and big data among the fastest-growing skills. It also shows that many employers plan to reorient their business around AI, which creates direct demand for AI training.
Generative AI training
Most employers now offer some form of generative AI training. Quality varies widely. Good programs teach people to use AI on real tasks from their own job. Weak ones show a demo and a policy slide.
AI-assisted learning content
AI speeds up first drafts of courses, scripts and assessments. It does not replace subject-matter review. A human still needs to check accuracy, tone and fit for your audience.
Personalized and adaptive learning
Adaptive learning adjusts content to what a learner already knows. It can cut time spent on material people have mastered. Vendors often claim big gains, so ask for the study behind the number.
AI coaching and simulations
AI role-play tools let managers and sales reps practice hard conversations with instant feedback. This is a promising area. Independent evidence is still thin, so pilot before you scale.
How organizations should measure AI training
AI adoption is not the same as AI training effectiveness. Knowing that 70% of your staff logged into an AI course tells you nothing about whether they now work better.
Measure these instead:
- Whether people use AI tools in their real tasks after training
- Time saved or quality gained on specific tasks
- Error and compliance rates
- Manager observations of changed behavior
Employee Learning and Development Statistics
Employee demand for learning
Employees consistently say they want chances to learn and grow. Gallup and LinkedIn both report this in their workplace research. The exact percentage shifts by survey, so cite the year and sample when you use one.
Learning preferences
People want training that fits their schedule, relates to their job, and comes with support from their manager. Very few say they want more long courses.
Self-paced learning
Self-paced learning gives people control over when they study. It scales well and costs less per learner. The trade-off is that motivation falls without reminders, deadlines or social accountability. Completion rates for open self-paced courses are often low for that reason.
Microlearning
Microlearning delivers short lessons, usually a few minutes each, on one narrow topic. It works well for refreshers and just-in-time help. It works poorly for complex skills that need practice and feedback.
Video and digital learning
Video is now a default format because it is easy to make and view. Short, focused videos tend to hold attention better than long lectures. Video alone rarely builds skill without a chance to practice.
On-the-job learning
Most real skill growth happens while doing the work. Stretch assignments, shadowing and feedback from a good manager often beat formal courses. Formal training works best when it prepares people for those moments.
Informal and peer learning
People ask colleagues, search internal chats and watch how others work. Practitioner communities like instructionaldesign show how L&D professionals talk about this in real life. Treat Reddit as anecdotal insight, not statistical evidence.
Participation is not learning. Someone can attend a workshop and change nothing. Track participation to see who showed up, then track skill and behavior to see who improved.
Career Development and Internal Mobility Statistics
Career development and employee retention
LinkedIn’s Workplace Learning Report for 2025 ties career development maturity to retention, confidence in profitability and AI adoption. Companies that help people see a path forward tend to look healthier on those measures. That does not prove career development caused the results.
Internal mobility
Internal mobility means filling roles with existing employees through moves and promotions. LinkedIn research has repeatedly linked it with longer employee tenure. It also saves hiring cost and keeps company knowledge in-house.
Leadership development
New managers are often promoted for technical skill and get little management training. That gap shows up in team engagement and turnover. Early, practical manager training is one of the safest L&D investments.
Mentoring and coaching
Mentoring gives people context and confidence that courses can’t. Coaching helps them apply new skills. Both are hard to scale, so many companies now pair them with digital tools.
Promotions and career progression
Clear promotion criteria reduce guesswork and frustration. When people don’t know what “next level” looks like, they start looking elsewhere.
Employee Training and Retention Statistics
Training and employee retention
Research from sources like LinkedIn and Gallup consistently finds that employees who see growth opportunities are more likely to stay. That pattern holds across many industries.
Career development and turnover
Lack of career growth is a commonly cited reason for leaving. Exit interviews at many companies show the same theme.
Learning opportunities and employee loyalty
Learning signals that the company invests in you. That builds goodwill, especially when the learning connects to a real next step.
Internal mobility and retention
People who move internally often stay longer than those who don’t. Part of the reason is that they see a future at the company.
Why retention statistics require careful interpretation
Be careful here. Retention statistics usually show a link, not a cause. Companies with strong training programs may also have better managers, better pay and healthier culture. Any of those could drive retention.
The idea is well known as correlation versus causation. Write “is associated with,” not “leads to,” unless the study used a design that supports the cause.
L&D Investment and Training Budget Statistics
Corporate training spending
Global corporate training spend runs into the hundreds of billions of dollars, depending on the analyst and what they count. Definitions differ. Some include employee wages during training, and some don’t.
Training expenditure per employee
Per-employee spend is one of the most cited benchmarks. The Association for Talent Development’s State of the Industry report and Training Magazine’s annual industry report both publish it. Use the latest edition and check the sample.
L&D budget trends
Budgets tend to rise and fall with the economy. In tight years, L&D teams are asked to do more with less. That is one reason measurement matters.
Training hours per employee
Average hours per employee vary widely by industry. Regulated fields like healthcare and finance log far more than most others. Compare yourself to your own sector.
Spending by organization size
Larger organizations spend more in total, but small firms often spend more per person on some items. Compare with companies of similar size.
Where L&D budgets are being allocated
Common categories include leadership development, technical skills, compliance, onboarding and, increasingly, AI skills. Compliance training is often the largest fixed cost.
How to benchmark your L&D budget
- Pick a benchmark from your industry and company size.
- Calculate your spend per employee and hours per employee.
- Compare, then ask why you differ. Higher isn’t always better.
- Tie the gap to a business goal.
L&D Technology Statistics
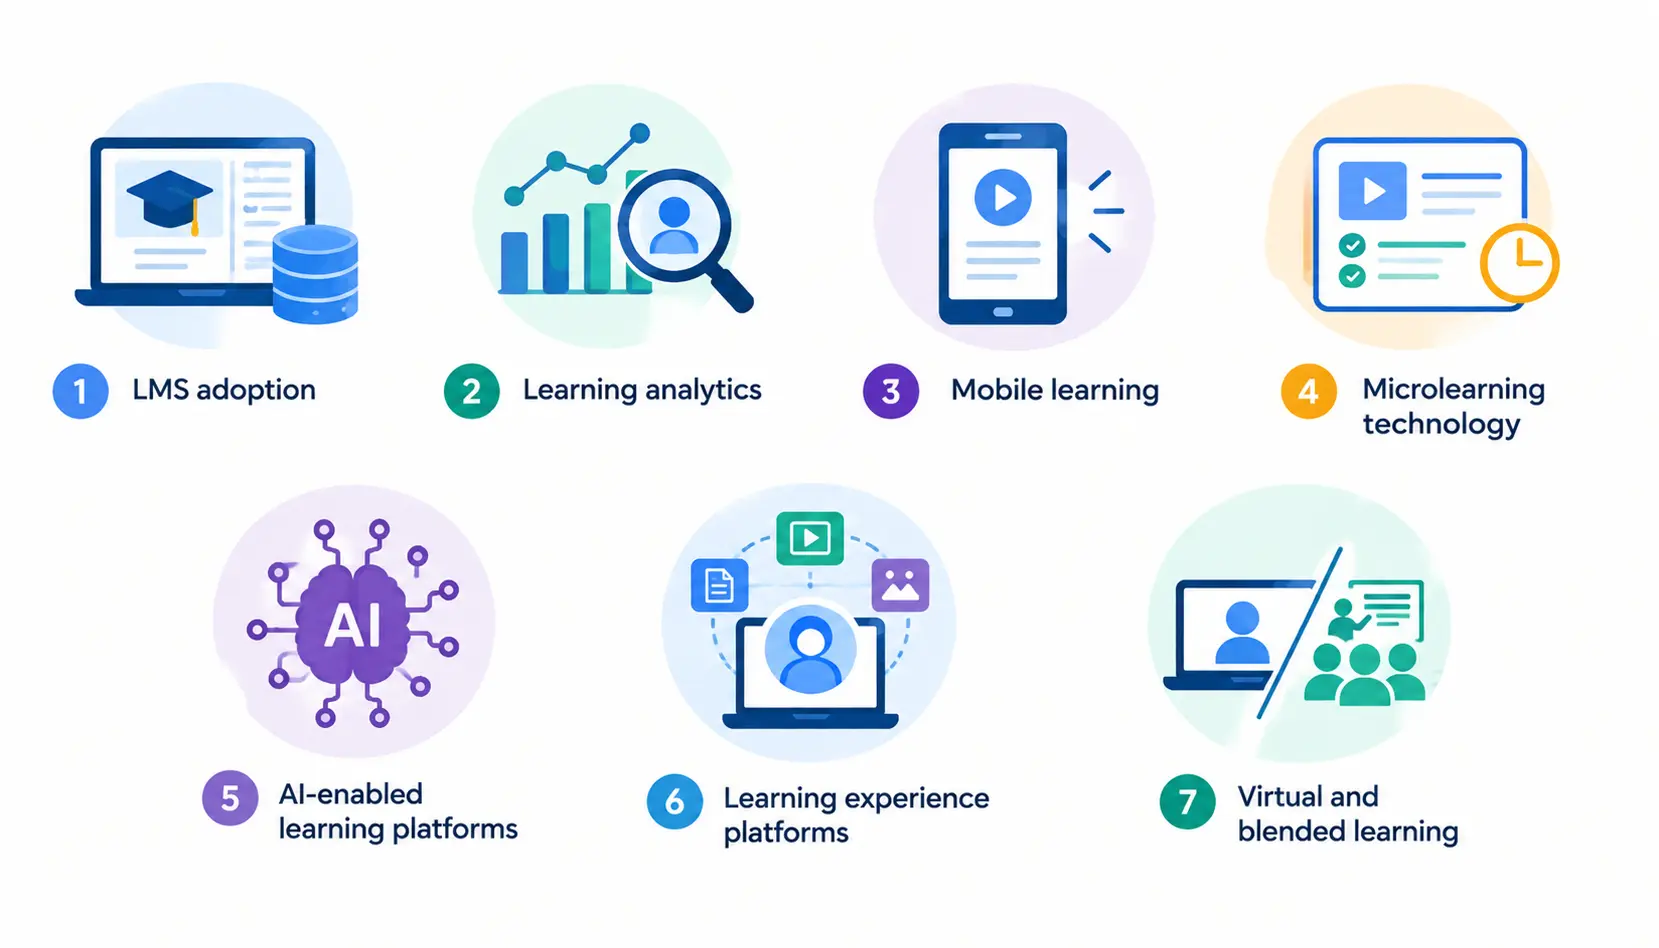
1. LMS adoption
A learning management system hosts, delivers and tracks training. Most mid-sized and large companies use one. The real question is whether yours gives you data you can act on.
2. Learning analytics
Learning analytics means using data to understand and improve learning. Many teams collect it but stop at completion counts. The next step is connecting learning data to performance data.
3. Mobile learning
Mobile access matters most for people who aren’t at a desk. Short lessons and quick reference tools suit it best.
4. Microlearning technology
Platforms now push short lessons, spaced reminders and quizzes to people over time. This supports memory, which links to the forgetting curve below.
5. AI-enabled learning platforms
Many platforms now add AI for recommendations, content creation and search. Ask vendors for evidence of results and for how they handle your data.
6. Learning experience platforms
A learning experience platform (LXP) pulls content from many sources and recommends it based on skills and interests. It sits on top of, or alongside, an LMS.
7. Virtual and blended learning
Virtual and blended learning became standard after 2020. Most companies now mix online and in-person formats, choosing by topic and audience.
L&D Statistics by Learning Format
Instructor-led training
Live, in-person sessions allow discussion and practice. They cost more and reach fewer people at a time.
Virtual instructor-led training
Virtual sessions keep the live element and remove travel. Engagement drops if the instructor lectures for too long.
Self-paced eLearning
Best for knowledge that doesn’t change often. Weak for complex behavior.
Microlearning
Best for reinforcement and quick help.
Mobile learning
Best for access on the go.
Blended learning
Combines formats. Usually the most effective for skills that need both knowledge and practice.
Social and peer learning
Cheap, fast and trusted by employees. Hard to measure.
| Format | Flexibility | Scalability | Engagement | Measurement | Best use case |
| Instructor-led | Low | Low | High | Moderate | Complex skills, leadership |
| Virtual instructor-led | Medium | Medium | Medium | Moderate | Remote teams, workshops |
| Self-paced eLearning | High | High | Variable | Easy | Compliance, product knowledge |
| Microlearning | High | High | Medium to high | Easy | Refreshers, reinforcement |
| Mobile learning | High | High | Medium | Easy | Frontline and field teams |
| Blended | Medium | Medium | High | Moderate | Skill building over time |
| Social and peer | High | Medium | High | Hard | Tacit knowledge, culture |
These ratings are my professional judgment, not measured data.
Frontline and Deskless Employee Training Statistics
Frontline access to training
Frontline workers, such as retail, hospitality, warehouse and healthcare staff, often have less training access than office workers. They don’t sit at a computer, and shift schedules make formal sessions hard.
Mobile learning for frontline workers
Phones and shared tablets solve much of the access problem. Lessons must be short and easy to open.
Microlearning adoption
Short lessons of a few minutes fit frontline breaks well. A five-minute safety refresher before a shift beats a one-hour annual session.
Training during the flow of work
Flow-of-work learning puts help where the task happens: a quick video on a machine, a checklist in an app, or a scan-and-learn code on equipment.
Frontline time to competency
Time to competency is how long a new hire takes to perform at standard. It is a strong frontline metric because it links directly to cost and quality.
Measuring frontline training impact
Look at safety incidents, error rates, customer scores and sales per hour. These show whether training changed work, which completion rates never will.
The Most Important L&D Metrics to Track
External statistics tell you about the market. Internal metrics tell you about your own people. Both matter, but only metrics can guide daily decisions.
Group your metrics into three levels: foundational (activity), learning effectiveness (skills), and business impact (results).
1. Completion rate
The percentage of learners who finish a course. It shows reach, not learning.
2. Participation rate
The percentage of eligible people who take part. Low participation may signal poor relevance or timing.
3. Learner engagement
Time spent, interactions and voluntary return visits. Useful when read alongside outcomes.
4. Assessment scores
Scores show what people know right after training. They can be gamed or too easy.
5. Knowledge retention
Retention checks what people still know weeks later. The forgetting curve, first described by Hermann Ebbinghaus, shows that memory fades fast without reinforcement. Spaced follow-ups help.
6. Skill proficiency
Rates how well someone performs a skill, using observation, simulation or work samples.
7. On-the-job application
Whether people use what they learned. Managers and peers are the best source.
8. Time to competency
Days or weeks until a new or reassigned employee performs at standard.
9. Employee performance
Ratings and output measures linked to trained skills.
10. Internal mobility
The share of roles filled from within, and how fast people move.
11. Employee retention
Turnover among trained versus similar untrained groups.
12. Training cost per employee
Total training cost divided by the number of employees trained.
13. Training ROI
Financial return after costs. This is the hardest to prove and the one leaders want most.
How to Measure the Business Impact of L&D
Move beyond completion rates
Completion says people clicked through. It doesn’t say they improved. Keep it as a basic health check and go deeper.
Connect learning objectives to business objectives
Start with the business problem. If customer complaints are rising, the learning goal is fewer complaints, not “finish the service course.”
Establish a baseline
Measure the metric before training starts. Without a starting point, you can’t show change.
Measure knowledge and skill change
Test before and after. Use realistic scenarios, not only multiple-choice questions.
Measure behavioral change
Ask managers to observe specific behaviors 30 to 90 days after training. The Kirkpatrick model, a widely used framework, describes four levels: reaction, learning, behavior and results. It gives you a clean way to structure this.
Measure business outcomes
Track the metric you set at the start: sales, errors, safety incidents, resolution time or turnover.
Calculate training ROI
Training ROI formula
ROI (%) = (Program benefits − Program costs) ÷ Program costs × 100
Example ROI calculation
A company trains 40 support agents. The program costs $20,000 for content, facilitator time and agent hours. Six months later, faster resolution and fewer escalations save an estimated $35,000.
ROI = ($35,000 − $20,000) ÷ $20,000 × 100 = 75%
The example is illustrative. Your savings estimate must come from real data, agreed with finance.
Avoid common attribution problems
Many things change at once: a new tool, a new manager, a seasonal spike. To limit this:
- Compare trained and untrained groups where possible
- Ask managers to estimate how much of the change came from training
- Be honest about uncertainty and show ranges
- Use “contributed to” language
L&D Statistics vs L&D Metrics: What’s the Difference?
L&D statistics come from outside research. L&D metrics come from your own systems.
| L&D statistics | L&D metrics | |
| Purpose | Understand the market | Measure your organization |
| Data source | External research | Internal systems |
| Use | Benchmarking | Decision-making |
| Example | % of employers prioritizing upskilling | Your training completion rate |
| Frequency | Usually periodic | Continuous or regular |
How to Evaluate Whether an L&D Statistic Is Reliable
I’ve watched confident numbers travel through slide decks with the source long gone. Use this checklist before you quote one.
Check the publication date
Data from before 2020 may not reflect today’s workplace.
Identify the research population
Who was surveyed: HR leaders, employees or executives? Each group sees things differently.
Check sample size
Small samples produce shaky results.
Understand geography
A US-only survey may not fit your market.
Look for the original research
Find the primary report. Many blog posts repeat a number with no source or with a wrong one.
Distinguish correlation from causation
“Linked to” does not mean “caused by.”
Separate projections from observed results
The WEF figures in this article are projections. Say so.
Watch for vendor-sponsored research
Vendor studies can be useful, but they often favor the vendor’s product. Read the method.
Don’t compare incompatible studies
Two surveys with different definitions and samples can’t be lined up in one chart.
What These L&D Statistics Mean for Organizations in 2026
Build skills-based learning strategies
Map the skills your business needs, find gaps, and train to close them.
Connect learning to career development
Show people where a new skill can take them.
Prepare employees for AI
Teach AI use on real tasks, with clear rules on data and quality.
Make learning available in the flow of work
Short, searchable, mobile help beats a course people never open.
Equip managers to reinforce learning
Managers decide whether training sticks. Give them simple prompts to coach after a course.
Measure outcomes rather than activity
Report skills, behavior and business results, not just hours.
Use data to identify future skill gaps
Combine role data, hiring plans and external forecasts to spot gaps early.
L&D Statistics to Watch Beyond 2026
- AI literacy: how widely and how well workers use AI
- Skill-based talent management: hiring and promoting on skills rather than titles
- Internal mobility: share of roles filled internally
- Personalized learning: evidence on adaptive systems
- Predictive learning analytics: using data to forecast skill gaps
- Learning in the flow of work: measured use of in-task support
- Measuring skill proficiency: better skill data across companies
- Business-impact measurement: more credible ROI studies
How to Use These L&D Statistics
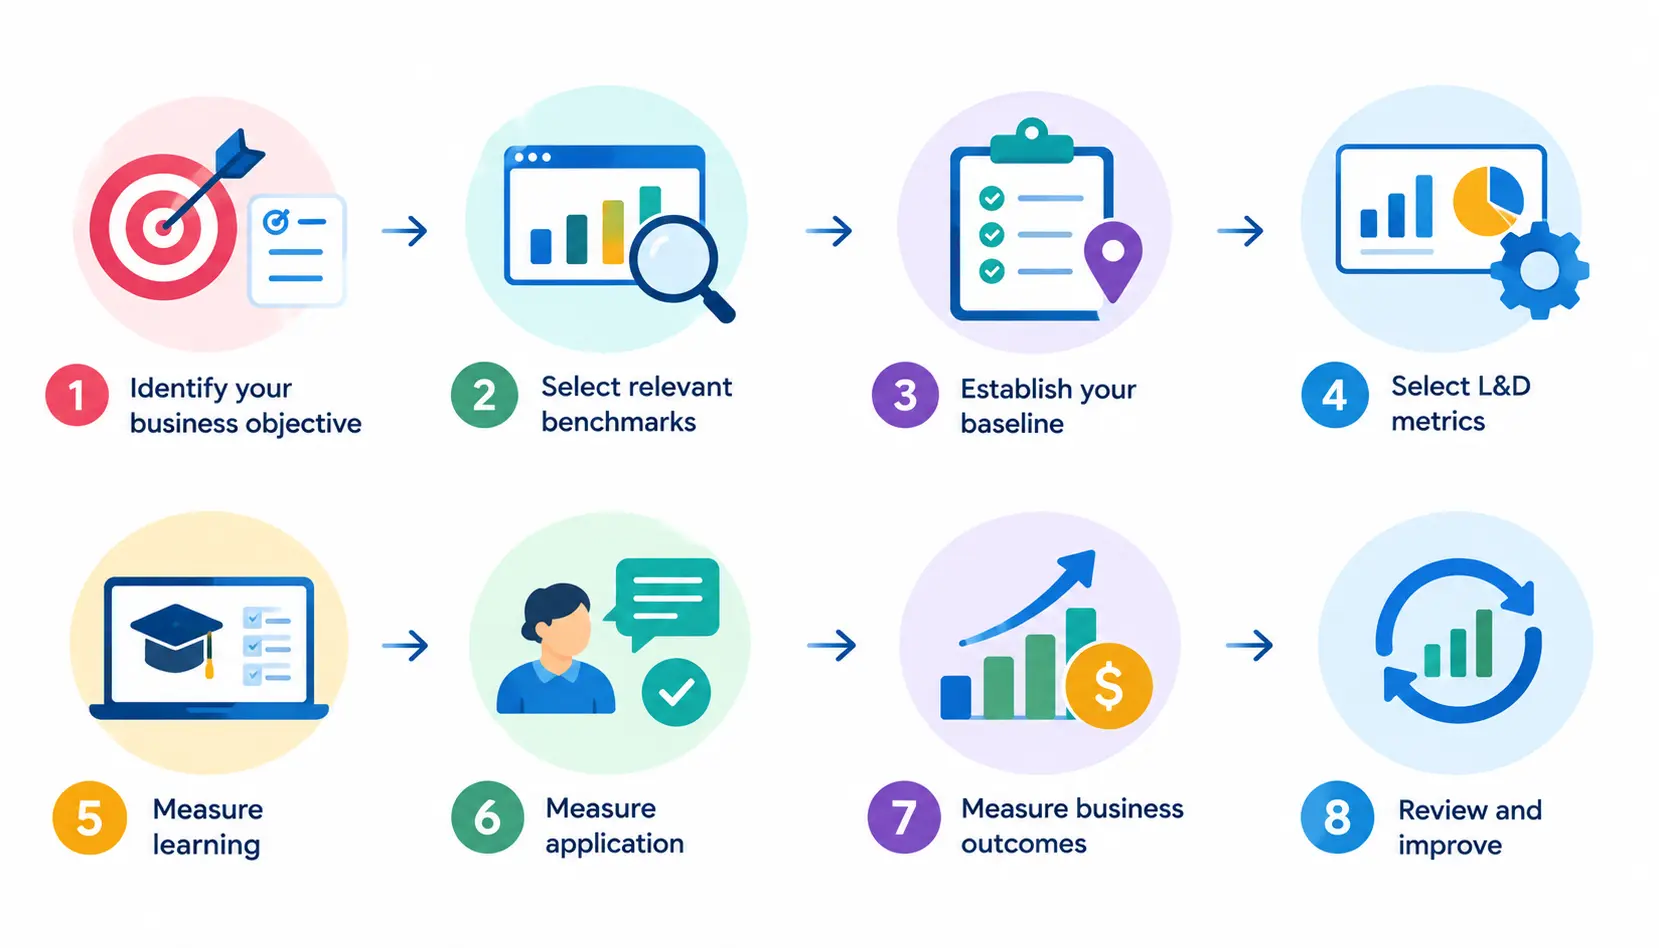
Step 1: Identify your business objective. For example, reduce onboarding time.
Step 2: Select relevant benchmarks. Choose statistics from your industry and region.
Step 3: Establish your baseline. Record where you are today.
Step 4: Select L&D metrics. Pick a few that match the goal.
Step 5: Measure learning. Use tests, simulations or work samples.
Step 6: Measure application. Ask managers what changed on the job.
Step 7: Measure business outcomes. Track the result you defined in Step 1.
Step 8: Review and improve. Keep what worked, drop what didn’t, and repeat.
Frequently Asked Questions About L&D Statistics
1. What are learning and development statistics?
They are data points from research that describe how organizations train employees, what workers want, and how skills and learning spending are changing.
2. Why are L&D statistics important?
They give you benchmarks, show workforce trends, and help you make a credible case for budget and priorities.
3. What are the most important L&D statistics in 2026?
The most useful are the WEF’s projections that about 39% of core skills will change by 2030 and that about 85% of employers plan to prioritize upskilling. Add LinkedIn’s career development findings and your industry’s training spend benchmarks.
4. What are the most important L&D metrics?
Start with participation, skill proficiency, on-the-job application, time to competency and a business outcome tied to your goal.
5. How much do companies spend on employee training?
It varies by industry and company size. The ATD State of the Industry report and Training Magazine’s annual report publish per-employee figures. Use the most recent edition.
6. How do you measure L&D effectiveness?
Set a business goal, take a baseline, measure learning and behavior change, then track the business outcome. The Kirkpatrick model gives a simple structure.
7. How do you calculate training ROI?
Subtract program costs from benefits, divide by costs, and multiply by 100. Use finance-approved estimates and be open about attribution limits.
8. How does AI affect learning and development?
AI speeds up content creation, personalizes learning and creates demand for AI skills. Adoption alone is not proof of results, so measure real use and outcomes.
9. Does L&D improve employee retention?
Research links learning and career growth to longer tenure, but the evidence is mostly correlational. Training helps most when it connects to visible career paths and good management.
10. What is the difference between L&D statistics and L&D metrics?
Statistics are external research used for benchmarking. Metrics are your own data used for decisions.
Conclusion
Learning and development statistics are useful when you treat them as context, not proof. The strongest 2026 signals are clear: skills are changing, employers want to upskill, AI is reshaping work, and career growth matters to retention.
The best L&D teams pair those statistics with their own metrics. They start with a business goal, measure skill and behavior, and report results honestly, including the limits of what they can prove.