


If you buy, run, or defend a training budget, you need numbers you can trust. LMS statistics help you see how big the market is, where it is heading, and what good performance looks like inside your own company.
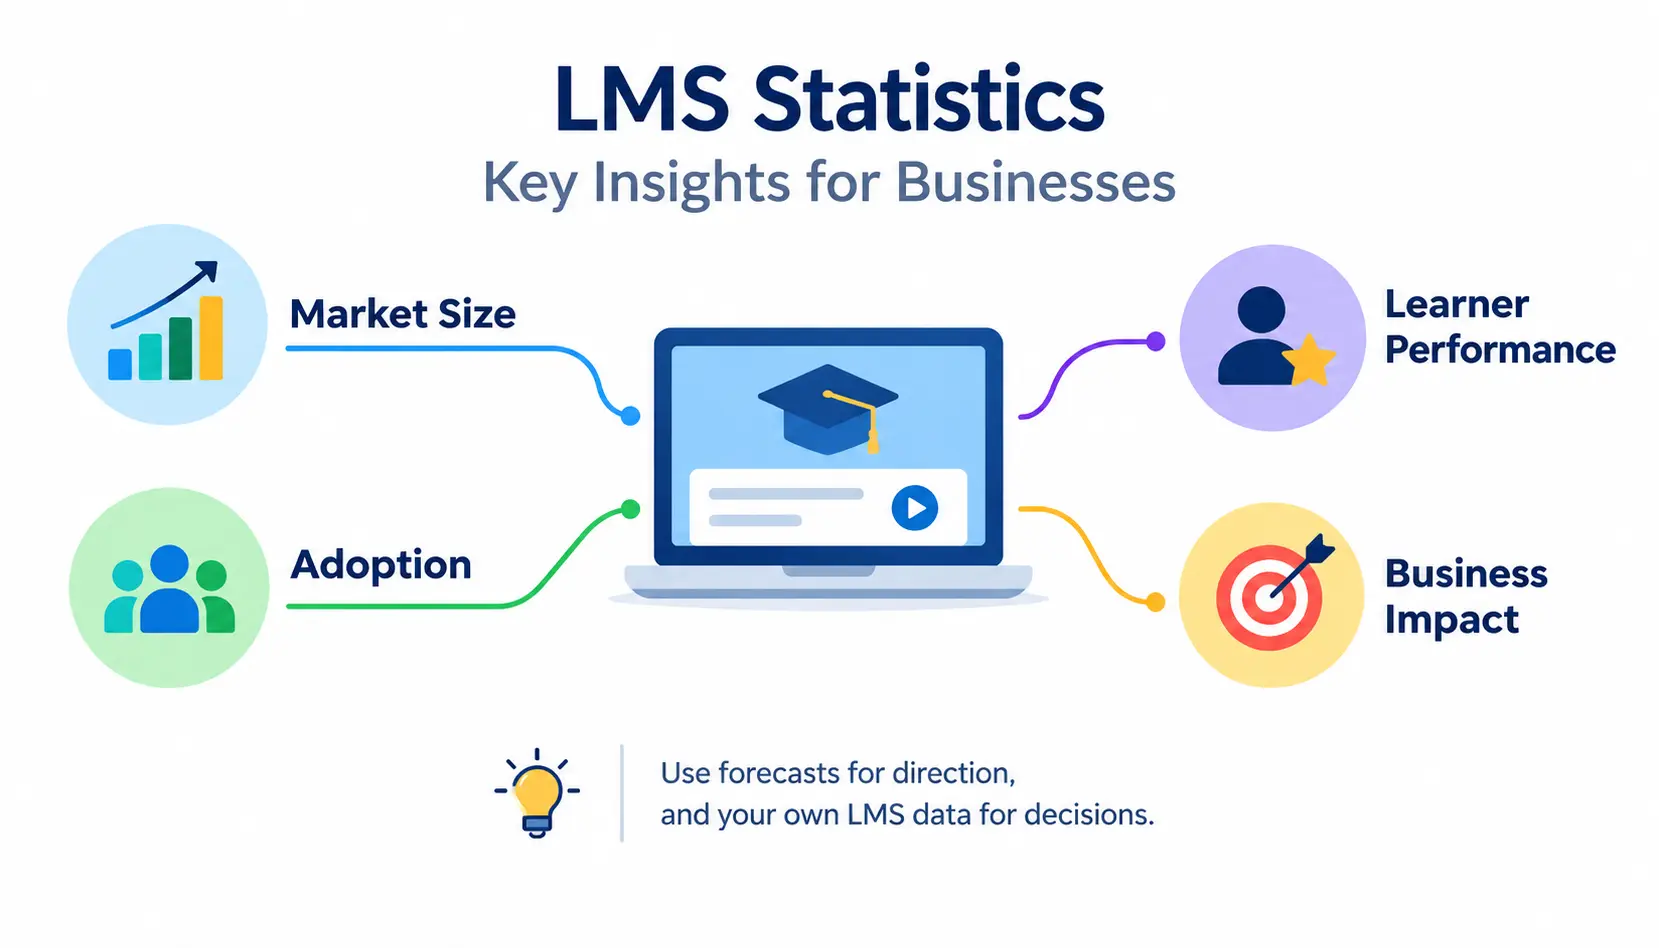
This guide covers four areas: market size, adoption, learner performance, and business impact. Every figure is tied to a year and a source, so you know how fresh it is and who produced it. Where no reliable public number exists, I say so instead of guessing.
One caution up front. Market forecasts and learner surveys measure different things. Use forecasts to understand direction, and use your own LMS data to make decisions.
LMS Statistics at a Glance
Here is a quick summary of the figures this article relies on. The sections below add context for each one.
| Category | Statistic | Year | Source |
| Global market | $24.09 billion (base value) | 2025 | Fortune Business Insights |
| Global market | $31.61 billion (projected) | 2026 | Fortune Business Insights |
| Global market | $104.04 billion (projected) | 2034 | Fortune Business Insights |
| Market growth | Roughly 16% CAGR (calculated from the figures above, 2026 to 2034) | 2026-2034 | Author calculation |
| India | $1.11 billion | 2025 | MarketsandMarkets |
| India | $1.93 billion (projected), 20.5% CAGR | 2030 | MarketsandMarkets |
| Regional market | Largest region varies by research firm; check each report | Varies | Individual reports |
| Corporate learning, training, ROI | Use your own LMS data (see the metrics sections) | Your period | Your LMS |
The CAGR row is my own arithmetic, not a published figure. Growing from $31.61 billion to $104.04 billion over eight years works out to about 16% a year.
What Is an LMS?
Learning management system definition
A learning management system (LMS) is software that delivers, tracks, and reports on training. Think of it as a school building for your company, but online. Courses live in one place, learners log in, and managers see who finished what.
If you want a neutral overview of the category, the Wikipedia entry on learning management systems is a good starting point.
What does an LMS do?
A good LMS handles seven jobs:
- Deliver learning: It hosts courses, videos, documents, and live sessions.
- Manage learners: It stores user profiles, groups, and roles.
- Track progress: It records enrollments, completions, and time spent.
- Assess performance: It runs quizzes, tests, and certifications.
- Report results: It turns activity into dashboards and exports.
- Support compliance: It proves who completed required training, and when.
- Identify skill gaps: It compares what people know with what the role needs.
A simple example: a retail chain with 40 stores uses its LMS to assign safety training to every new hire. The regional manager checks one dashboard on Friday and sees which stores are behind.
LMS vs LXP
An LMS is built around the organization. Admins assign courses, set deadlines, and track completion. A learning experience platform (LXP) is built around the learner. It recommends content, pulls in outside resources, and feels closer to a streaming service.
Many vendors now blend both. If compliance and reporting matter most, start with an LMS. If self-directed learning matters most, look at LXP features too.
Global LMS Market Statistics
Current LMS market size
Fortune Business Insights uses a 2025 base value of $24.09 billion for the global LMS market. It projects $31.61 billion for 2026. These are estimates from one research firm, so treat them as a reference point, not a fact carved in stone.
LMS market growth rate
The compound annual growth rate (CAGR) shows the average yearly growth over a period. If you want a plain explanation, see compound annual growth rate.
Forecasts differ between research firms for three reasons. They define the market differently (software only, or software plus services). They pick different base years. And they use different data sources. When two reports disagree, compare their definitions before you pick a side.
Projected LMS market size
Fortune Business Insights projects the global LMS market will reach $104.04 billion by 2034. That is more than three times its 2026 projection of $31.61 billion. Even if the real figure lands lower, the direction is clear: companies keep investing in digital learning.
What is driving LMS market growth?
Several forces push demand up:
- Digital transformation: Companies are moving training off paper and out of classrooms.
- Corporate training: Larger workforces need consistent, trackable onboarding.
- Upskilling and reskilling: New tools and roles mean people must learn constantly.
- Remote and hybrid work: Teams spread across locations need training they can reach anywhere.
- AI: Vendors are adding content creation, recommendations, and smarter search.
- Cloud adoption: SaaS platforms lower the cost and effort of getting started.
- Compliance requirements: Regulated industries must prove training happened.
LMS Market Statistics by Region
Research firms rank regions differently, and the numbers change with each report. I won’t quote regional shares I can’t verify. Instead, here is how to read a regional breakdown, and what usually shapes each region.
North America
North America is often described as the most mature LMS market. Companies there tend to have older systems and replace or upgrade them. Compliance training and large enterprise buyers drive a lot of demand.
Europe
Europe has strong demand tied to data protection, workplace safety rules, and multilingual training needs. Buyers often care about privacy features and local hosting.
Asia-Pacific
Asia-Pacific is usually cited as the fastest-growing region. Large young workforces, fast digital adoption, and government skilling programs all push growth.
Middle East and Africa
Growth here is linked to national workforce programs and rising mobile access. Many organizations are adopting cloud platforms directly, without older systems to replace.
Latin America
Latin America shows rising interest in mobile-first, cost-friendly platforms. Corporate training and education providers both drive adoption.
How to build your own comparison table. For each region, pull these five items from the same report so the numbers stay comparable: market size, market share, CAGR, forecast, and major growth drivers. Mixing sources in one table is the fastest way to publish a wrong comparison.
LMS Statistics in India
India LMS market size
MarketsandMarkets reports India’s LMS market at about $1.11 billion in 2025. That is a small slice of the global total, but a fast-moving one.
India LMS market growth
The same firm projects about $1.93 billion by 2030, at a 20.5% CAGR. Note that this CAGR is higher than the global rate calculated earlier. India is growing from a smaller base, which makes high percentages easier to reach.
Corporate LMS adoption in India
I could not find a single, reliable public figure for the share of Indian companies using an LMS, so I will not invent one. What you can say safely: large employers and training-heavy sectors lead adoption, while smaller firms often start with simple, low-cost cloud tools.
Key industries using LMS in India
- IT/ITeS: Constant reskilling on new technologies.
- BFSI (banking, financial services, insurance): Mandatory compliance and certification.
- Healthcare: Clinical protocols and safety training.
- Manufacturing: Plant safety, process training, and contract workforce onboarding.
- Retail: High staff turnover, so fast onboarding matters.
- Telecom: Large field teams and product training.
Corporate LMS Statistics
Public corporate-training surveys vary a lot in method and sample. For decisions, your internal numbers matter more. Here is how companies typically use an LMS, and what to measure in each case.
LMS use for employee training
This is the core use of an LMS for employee training. Measure participation (who enrolled), completion, and assessment results by team.
LMS use for onboarding
New hires need the same essentials, delivered on time. Track time-to-completion and how quickly new hires reach productivity.
LMS use for compliance training
Here the goal is proof. Track completion before the deadline, overdue learners, and certificate records.
LMS use for upskilling and reskilling
Link courses to skills, not just job titles. Track skill progress before and after training.
LMS use for customer and partner training
External learners need separate access, branding, and reporting. Track product adoption and support ticket volume alongside course data.
LMS and workforce development
Use the LMS to map learning paths to career steps. Track promotions, internal moves, and retention among people who take part.
For real-world discussion from practitioners, the instructional design community is worth reading. People there share honest views on what works and what doesn’t.
LMS Engagement and Learner Statistics
Industry-wide benchmarks for these numbers change by sector, course type, and audience. A 30-minute compliance module and a 10-hour technical course should never share a benchmark. Build your own baseline first.
Active users
Count learners who log in during a set period, such as 30 days. Compare them to total licensed users.
Course enrollment
Enrollment shows interest, or in mandatory training, assignment. Separate voluntary enrollments from assigned ones.
Course completion rates
Completion is the share of enrolled learners who finish. It is easy to measure, but it only tells you people reached the end.
Learner engagement
Look at video watch time, discussion posts, quiz attempts, and return visits. These show attention, not just attendance.
Time spent learning
Time alone can mislead. A short, clear course might beat a long, confusing one. Compare time with assessment results.
Learner satisfaction
Use short post-course ratings and one open comment box. Comments often show problems the numbers hide.
Assessment performance
Track first-attempt scores and retakes. If most learners fail the same question, the course needs fixing, not the learners.
The Most Important LMS Metrics for Businesses
Docebo and other vendors stress that companies should look beyond completion rates to metrics tied to learner outcomes and business impact. I agree. Here are the metrics I would track, in plain terms.
Completion rate
The share of learners who finish a course. Use it as a health check, not a success score.
Engagement rate
The share of learners who actively interact, not just open the course.
Assessment scores
Average scores and pass rates show whether people learned the material.
Learner satisfaction
Ratings and comments show whether learners found the training useful.
Course abandonment
The share who start but stop. Check where they stop. That spot usually points to the problem.
Time to completion
How long learners take from assignment to finish. Long delays often mean unclear deadlines or poor course design.
Certification rate
The share of learners who earn required certificates. Vital in regulated roles.
Skill proficiency
A measure of how well learners perform specific skills, often through assessments or manager reviews.
Training participation
The share of eligible employees who take part in any training during a period.
Business-impact metrics
These link learning to results: fewer safety incidents, faster ramp-up, higher sales, better customer scores. They are harder to measure but matter most.
LMS Analytics Statistics and Insights
What LMS analytics measure
LMS analytics collect and summarize learning data: who learned, what they learned, how they performed, and how that connects to goals. The field is often called learning analytics.
How analytics identify skill gaps
Compare assessment results with the skills a role requires. If a whole team scores low on one topic, you have found a gap.
How analytics improve learner engagement
Spot courses with high drop-off, then shorten them, split them, or add practice. Retest and compare.
How dashboards support decision-making
A good dashboard answers three questions fast: who is behind, what is working, and what needs attention. Keep it simple, or nobody will use it.
LMS analytics and business intelligence
Some platforms send learning data to business intelligence tools. That lets leaders view training next to sales, quality, or support data.
Integrating LMS data with HRIS, HCM and CRM systems
HRIS and HCM systems hold employee records. CRM systems hold customer and sales data. Connecting them to your LMS lets you ask better questions, such as whether sales reps who finished product training closed more deals. Vendors like isEazy highlight analytics for engagement, completion, outcomes, and ROI, and MapleLMS discusses combining LMS data with tools such as Salesforce.
LMS Statistics on Training ROI and Business Performance
I won’t quote a headline ROI percentage here. Published figures vary by industry and method, and many come from vendor-sponsored studies. Your own results are a better guide.
Training cost reduction
Compare costs before and after moving to an LMS: instructor fees, travel, venue, printing, and admin time.
Employee productivity
Measure how fast new hires reach full output, and how often experienced staff make errors.
Employee performance
Use manager ratings, quality scores, or task results before and after training.
Revenue impact
For sales and customer training, compare trained and untrained groups over the same period.
Employee retention and development
Check whether people who use learning paths stay longer. Remember this shows a link, not proof of cause.
How to calculate LMS ROI
Use this simple formula:
LMS ROI = (Training Benefits − Training Costs) ÷ Training Costs × 100
Here is a quick example. Say your LMS and content cost ₹10 lakh in a year. You estimate savings and gains of ₹15 lakh. ROI = (15 − 10) ÷ 10 × 100 = 50%.
The hard part is the “benefits” number. Define it with finance before you start, and keep your assumptions written down.
Why completion rate alone doesn’t prove ROI
A learner can finish a course and learn nothing. They can also skip the course and still perform well. Completion shows activity. ROI needs evidence of changed behavior or better results.
The Kirkpatrick model is a classic way to think about this. It looks at reaction, learning, behavior, and results, in that order.
LMS Technology Trends Shaping Business Learning
Current LMS material increasingly emphasizes AI, analytics, personalization, mobile delivery, and cloud platforms. Here is what each trend means in practice.
Artificial intelligence
AI helps draft course content, answer learner questions, tag content, and suggest next steps. Always have a person review AI-generated training before it goes live.
Personalized learning
Learners see content that fits their role, level, and goals.
Adaptive learning
The course changes as the learner performs. Strong learners skip ahead, while others get extra practice.
Microlearning
Short lessons, often a few minutes each, built for one clear goal. See Wikipedia on microlearning for background.
Mobile learning
Phone-friendly courses suit field teams, retail staff, and anyone away from a desk.
Gamification
Points, badges, and leaderboards can lift motivation when used with care. Overdo it, and it feels childish.
Predictive analytics
Systems flag learners likely to fall behind, so managers can step in early.
Cloud and SaaS LMS
Cloud platforms update automatically and scale easily. Check data location and security terms before you sign.
Skills-based learning
Instead of assigning courses by job title, companies map learning to skills they need.
LMS Statistics by Business Use Case
Employee onboarding
Track time to first task, completion of required modules, and manager feedback at 30 and 90 days.
Compliance training
Track on-time completion, overdue counts, and audit readiness.
Sales enablement
Track product knowledge scores, ramp-up time, and win rates for trained reps.
Customer education
Track course usage, product adoption, and support ticket trends.
Partner training
Track certified partners, partner-sourced revenue, and quality of partner support.
Professional development
Track participation, skill growth, and internal promotions.
Technical skills training
Track lab or practical assessment results, not just quiz scores.
LMS Adoption by Organization Size
Company size changes what you should look for. Here is how needs differ across seven areas.
| Requirement | Small businesses | Mid-sized businesses | Enterprises |
| Learner volume | Dozens to a few hundred | Hundreds to a few thousand | Thousands to hundreds of thousands |
| Integrations | Few, often email and video | HRIS and single sign-on | HRIS, HCM, CRM, BI tools |
| Reporting | Basic completion reports | Team and department views | Custom, cross-system analytics |
| Security | Standard protections | Role-based access, SSO | Advanced controls, audits, data residency |
| Administration | One person, part-time | Small L&D team | Dedicated team, multiple admins |
| Scalability | Moderate | Growing needs | Global, multi-language, multi-brand |
| Compliance | Light | Industry-specific | Complex, multi-region |
Small businesses
Choose ease of use and low cost. You rarely need advanced analytics at the start.
Mid-sized businesses
Integrations and reporting start to matter. A corporate training platform can help centralize learning, reporting, and employee training as your needs grow.
Enterprises
Security, scalability, and integrations lead the list. Plan implementation carefully, because switching later is expensive.
How to Use LMS Statistics to Make Better Business Decisions
Start with business objectives
Pick the goal first, such as faster onboarding or fewer safety incidents. Then choose the numbers that show progress.
Establish a baseline
Record where you stand today. Without a baseline, you cannot show improvement.
Select relevant LMS metrics
Track a few metrics that match your goal. Ten dashboards nobody reads help no one.
Segment your data
Break results down by team, role, location, and tenure. Averages often hide the real story.
Connect learning data with business data
Pair LMS data with performance, sales, or quality data. This is where real insight appears.
Measure outcomes over time
Track results over months, not days. Behavior change takes time to show.
Turn insights into training improvements
Fix weak modules, remove unused content, and retest. Share the wins with leadership so training keeps its budget.
How to Evaluate the Reliability of LMS Statistics
Bad numbers spread fast. Before you quote or act on any statistic, run it through these checks.
Check the publication date
A 2019 figure rarely describes 2026. Prefer data from the last one to two years.
Identify the original source
Many articles repeat each other. Follow the link back to the report or survey that first published the number.
Check sample size
A survey of 100 people cannot speak for a whole industry.
Check geographic scope
A US survey may not apply to India, and the reverse is also true.
Separate surveys from market forecasts
Surveys report what people said. Forecasts are models built on assumptions. They answer different questions.
Distinguish correlation from causation
If engaged learners also perform better, the LMS may not be the reason. Motivated people may simply do both.
Don’t compare incompatible statistics
Different definitions, years, and currencies make comparisons misleading. Compare like with like. Professionals also trade notes on LInkedin, but check the original source behind any number you see in a post.
LMS Statistics: What Businesses Should Watch Next
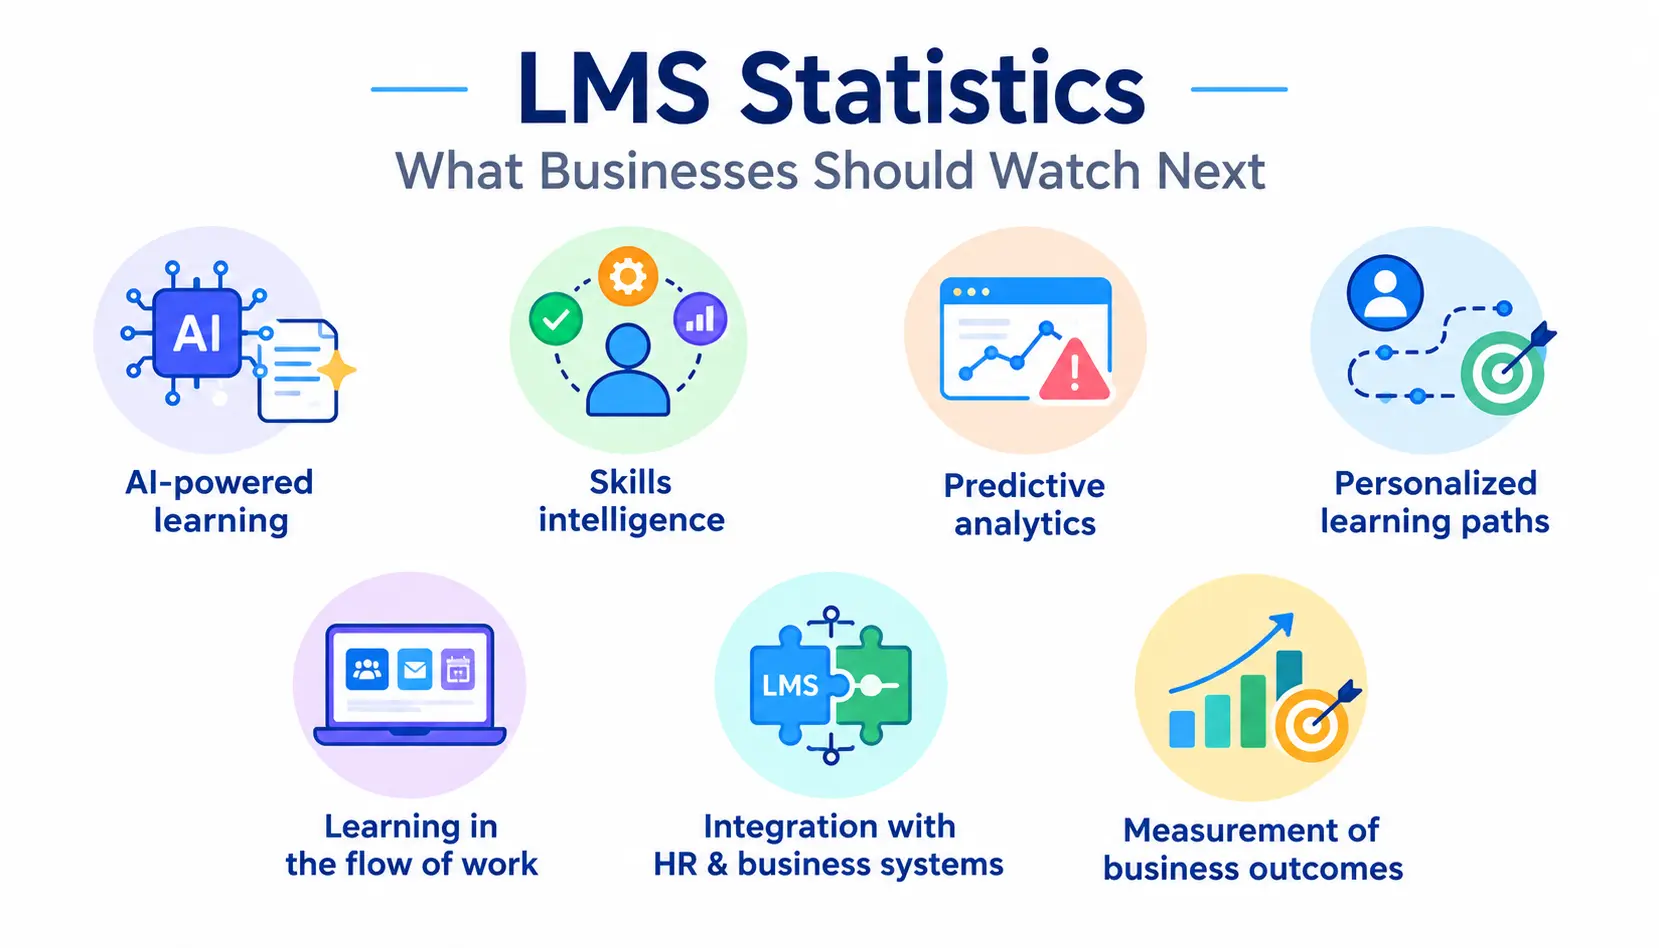
AI-powered learning
Expect more AI help in content creation, coaching, and search. Quality control will matter more than speed.
Skills intelligence
Companies want a live picture of the skills they have and the skills they lack.
Predictive learning analytics
Early warning on learners who struggle will become a standard feature.
Personalized learning paths
Paths will adjust to each person’s role, goals, and past results.
Learning in the flow of work
Training will appear inside the tools people already use, not only in a separate portal.
Integration with HR and business systems
Links between the LMS and other systems will make it easier to connect learning to performance.
Measurement of business outcomes
Leaders will ask for proof of results, not just course completions.
Frequently Asked Questions About LMS Statistics
1. What is the current LMS market size?
Fortune Business Insights uses a 2025 base value of $24.09 billion and projects $31.61 billion for 2026. Other research firms publish different figures because they define the market differently.
2. How fast is the LMS market growing?
Based on Fortune Business Insights’ projections of $31.61 billion in 2026 and $104.04 billion in 2034, the implied growth rate is roughly 16% a year. India’s market is forecast to grow faster, at 20.5% CAGR through 2030, according to MarketsandMarkets.
3. What are the most important LMS statistics for businesses?
Start with market size and growth for context. Then focus on your own completion rate, engagement, assessment scores, and business-impact metrics.
4. What LMS metrics should businesses track?
Track completion rate, engagement rate, assessment scores, learner satisfaction, abandonment, time to completion, certification rate, and skill proficiency. Add one or two business-impact measures tied to your goal.
5. How do you measure LMS ROI?
Use this formula: (Training Benefits − Training Costs) ÷ Training Costs × 100. Define benefits clearly before you begin, and compare results with a baseline.
6. What is LMS analytics?
LMS analytics is the collection and analysis of learning data to improve training and show results. It covers participation, performance, skill gaps, and links to business outcomes.
7. How does an LMS improve employee training?
An LMS gives everyone consistent content, tracks progress automatically, and shows managers where people struggle. It also keeps compliance records in one place.
8. What are the latest LMS trends?
AI, personalization, adaptive learning, microlearning, mobile delivery, gamification, predictive analytics, cloud platforms, and skills-based learning.
9. What is the difference between LMS statistics and LMS metrics?
LMS statistics are numbers about the market or broad trends, usually from outside sources. LMS metrics are measurements from your own platform, such as your completion rate.
10. What is the future of LMS technology?
Expect smarter personalization, deeper integration with HR and business tools, and stronger focus on proving business results.
Conclusion
LMS statistics give you context, but they do not make decisions for you. Market numbers show that investment in digital learning is growing, and India is growing faster than the global average. Your own metrics show whether your training works.
Start with a clear goal, set a baseline, and track a small set of metrics. Connect learning data to business results, and check every outside statistic against its original source. Do that, and LMS statistics become a tool you can defend in any budget meeting.