


New hires form opinions fast. Within days, they know whether the company is organized, whether their manager cares, and whether the job matches what they were promised. That early experience shapes how long they stay and how soon they do good work.
That is why employee onboarding statistics and industry benchmarks matter. They show you where your process stands and where to focus. But many onboarding numbers online are old, unsourced, or taken out of context.
Here are two findings worth knowing from the start. Gallup has reported that only about 12% of employees strongly agree their organization does a great job onboarding. Gallup has also estimated that replacing an employee can cost anywhere from half to two times their annual salary.
Benchmarks vary by industry, role, country, and how a study defines “onboarding.” So this guide does three things. It shares statistics with their sources and limits. It shows you how to measure your own onboarding. And it explains how to improve it without chasing numbers that don’t apply to you.
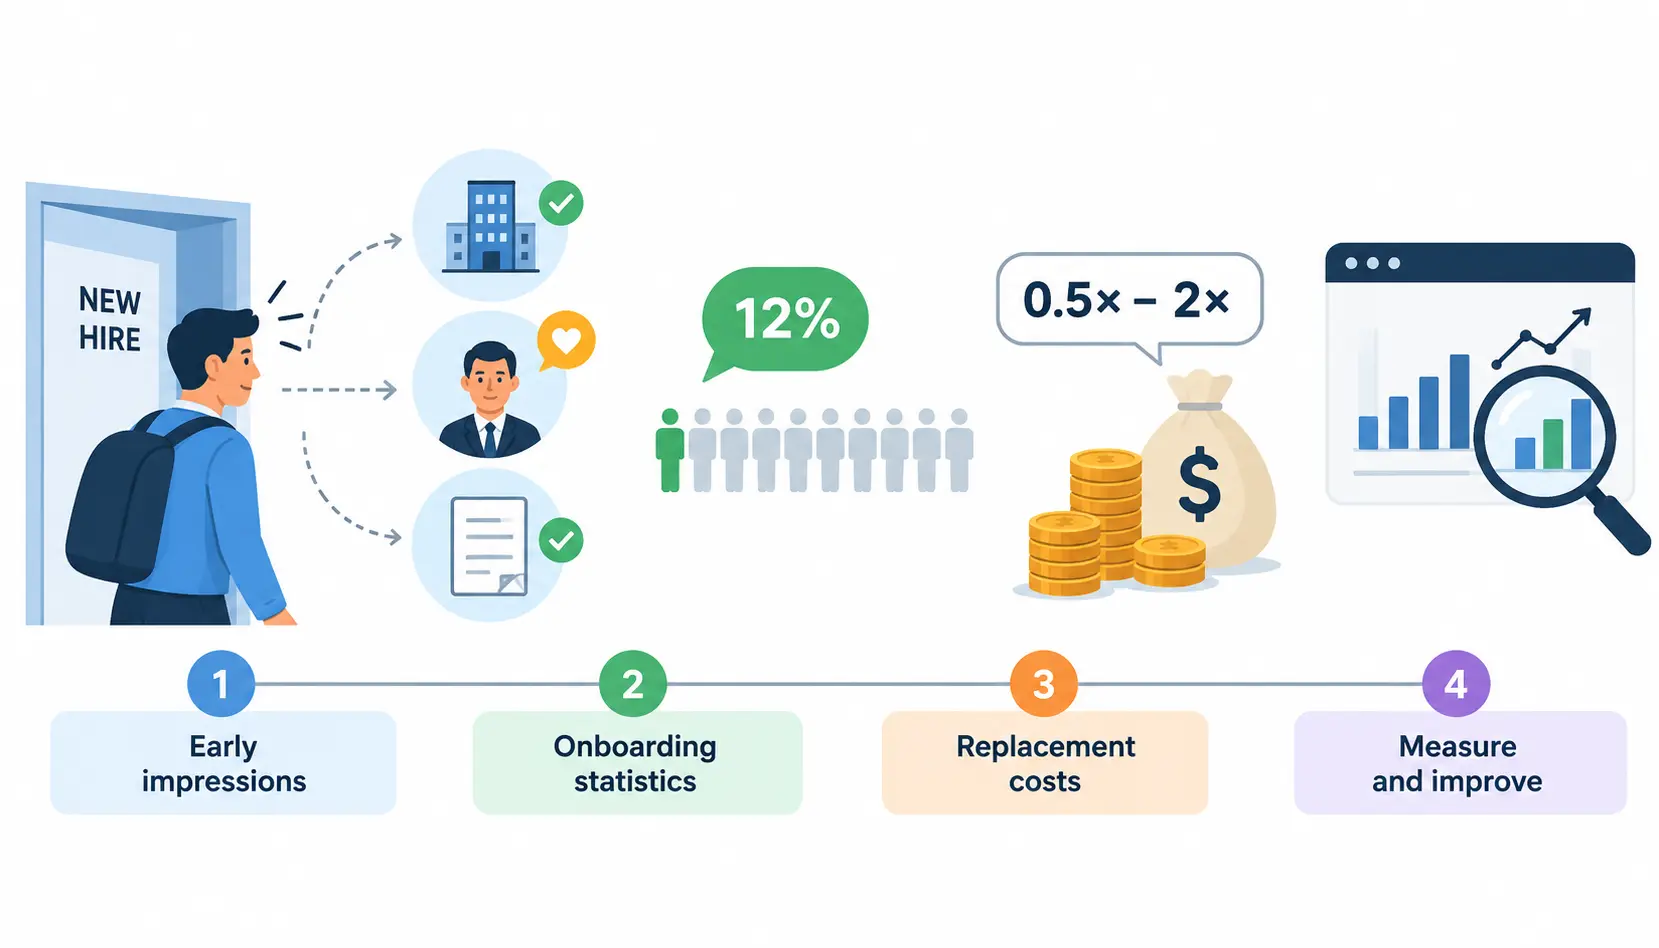
Key Employee Onboarding Statistics at a Glance
Here are the figures most often cited, with the context you need to use them honestly.
| Metric | Figure | Source | Population | Notes |
| Employees who strongly agree their organization onboards well | About 12% | Gallup (c. 2017) | U.S. employees | Measures strong agreement, not failure |
| New hires who strongly agree onboarding prepared them to excel | About 29% | Gallup (c. 2019) | U.S. employees | Self-reported readiness |
| Cost to replace an employee | 0.5x to 2x annual salary | Gallup | Broad U.S. estimate | Varies a lot by role and seniority |
| Strong onboarding and retention or productivity gains | 82% and 70%+ | Brandon Hall Group, often repeated by Glassdoor | Not fully public | Treat as directional; see below |
| Employees who left a job within six months | About 31% | BambooHR (c. 2018) | Survey respondents | Vendor survey, not a general rate |
A caution applies to every row. Years and methods change, so open the original report before you publish or present any of these. Start with Gallup’s workplace research,SHRM, and the U.S. Bureau of Labor Statistics JOLTS data for broader separation rates.
The Most Important Onboarding Statistics
The research tends to cluster around a few themes:
- Perceptions: Few employees rate their onboarding as excellent.
- Early regret: A meaningful share of people leave jobs within months.
- Retention: Better onboarding is linked to higher intent to stay.
- Productivity: Structured onboarding is linked to faster ramp-up, though rigorous proof is thin.
- Manager involvement: Employees repeatedly point to their manager as central to a good start.
- Technology: Adoption of onboarding software is growing, but adoption is not the same as effectiveness.
What the Statistics Tell Us About Onboarding Today
The most consistent pattern is that many organizations do the paperwork well and the human side poorly. Role clarity, manager time, and social connection are where employees most often report gaps.
The evidence is weaker on exact numbers. Studies define “onboarding” differently. Some mean a one-day orientation, others a twelve-month program. Samples also differ by country, industry, and company size. So use these figures to spot patterns, not to set precise targets.
Employee Onboarding Effectiveness Statistics
How Many Employees Say Their Onboarding Is Effective?
Gallup’s best-known finding is that only about 12% of employees strongly agree their organization does a great job onboarding.
Read that carefully. It counts only people who chose the top answer. It does not mean 88% had a bad experience. Many likely gave a lukewarm rating. Still, it tells you that truly excellent onboarding is rare.
How Do New Hires Feel After Onboarding?
Gallup has also reported that fewer than a third of new hires strongly agree their onboarding prepared them to excel. That is a statement about confidence, not performance.
Keep those two things apart. A new hire can feel unprepared and still perform well. Another can feel great and struggle. Track sentiment through surveys and performance through real work outcomes, and never swap one for the other.
What Do Employees Expect From a Good Onboarding Experience?
Most new hires want the same basics:
- Clear performance goals for the role
- Working tools, accounts, and access on day one
- Introductions to teammates and key contacts
- Training on how the work gets done, plus cultural context
- A plan for the first 30, 60, and 90 days
None of this is expensive. Most of it is coordination.
Employee Onboarding and Retention Statistics
How Does Onboarding Affect Employee Retention?
Research links good onboarding to a stronger intent to stay. Gallup reports that employees who strongly agree with their organization onboards well are more likely to be highly satisfied with their workplace.
Notice the word intent. Saying you plan to stay is not the same as staying. When you read a retention claim, check whether the source measured intentions or actual employment records.
The widely repeated claim that strong onboarding improves new-hire retention by 82% comes from Brandon Hall Group research. Because the full methodology isn’t public, treat it as a directional signal and not a guarantee.
New-Hire Turnover in the First 30, 60, and 90 Days
Early turnover is the clearest signal of an onboarding problem, but few public sources define the period and the denominator well. A BambooHR survey found roughly three in ten respondents had left a job within six months. That is a vendor survey, not a national rate.
You are better off measuring your own. Use this formula:
New-hire turnover rate = (new hires who left within X days ÷ total hires in that cohort) × 100
Pick one window, such as 90 days, and use it every time. Report voluntary and involuntary exits separately. A person you let go in week three tells a different story than one who resigned.
Long-Term Retention After Onboarding
Some sources claim great onboarding makes employees far more likely to stay three years. The figure is repeated often, but it is hard to trace to a clearly documented original study. Use it with care, or skip it.
What we can say with more confidence is that long-term retention depends on many factors. Job fit, manager quality, pay, working conditions, and career growth all matter. Onboarding sets the tone, but it can’t fix a poor job.
Why Employees Leave During Early Employment
Early exits usually trace back to a handful of causes:
- Unclear expectations about the role or success
- Poor communication from the manager
- Too little training
- A gap between the job as advertised and the job as done
- Weak relationships or a lack of belonging
Notice how many of these are fixable before day one. That’s the good news.
Employee Onboarding Productivity and Time-to-Proficiency Benchmarks
How Long Does It Take New Employees to Become Productive?
Time to productivity is the time between a new hire’s start date and the point they reliably perform at an agreed standard.
There is no universal number. A call-center agent may reach the standard in weeks. A senior engineer or sales leader may need many months. Anyone quoting one average for all jobs is guessing.
Instead of borrowing a figure, set your own role-specific benchmark. Ask your best managers how long a strong hire typically takes to reach full output. Use that as your baseline and label it as internal.
How Structured Onboarding Affects Productivity
Several industry sources link structured onboarding to faster ramp-up. The best-known claim, a productivity gain of more than 70%, again traces to Brandon Hall Group.
The limits are real. Most studies are surveys, not controlled experiments. Companies with strong onboarding often also have better managers and better hiring. So onboarding may deserve only part of the credit. To make onboarding more effective, organizations can follow a structured approach to building an effective employee training program with clear learning objectives and role-specific training.
Time to Productivity vs. Time to Proficiency
People use these terms loosely, so define them before you track them:
- Time to productivity: when the person contributes meaningfully, even if not at full speed.
- Time to proficiency: when the person performs at the full standard expected of the role.
Pick one, write down the threshold for each role, and stick with it.
How to Measure Productivity During the First 90 Days
Keep it simple:
- Set three to five role-specific milestones before the person starts.
- Review progress at 30, 60, and 90 days.
- Combine the manager’s assessment with measurable work outcomes, such as tickets closed, accounts handled, or quality scores.
- Record where and why people fell behind.
Employee Onboarding Costs and ROI Statistics
How Much Does Employee Onboarding Cost?
Keep three costs separate. Recruitment cost covers sourcing and hiring. Onboarding cost covers getting a hire ready. Replacement cost covers the full loss when someone leaves.
Onboarding costs include direct items such as equipment, software licenses, and training materials. They also include indirect items such as HR time, manager time, and the lost output of teammates who help the newcomer.
Whenever you cite a cost figure, state the country, year, and population. A number from a U.S. enterprise study may not fit a small business in another country. For benchmarks, check the latest SHRM benchmarking reports.
What Does Poor Onboarding Cost Employers?
Poor onboarding can cost money through early departures, repeat recruiting, retraining, and slower productivity. Gallup’s estimate that replacement can cost between half and twice a salary shows how high the stakes can be.
Be fair, though. Not every early exit is an onboarding failure. Some people simply aren’t the right fit. Count only the departures you can reasonably trace to avoidable onboarding problems.
How to Calculate Onboarding ROI
Return on investment, or ROI, compares what you gain with what you spend:
ROI (%) = (Benefits − Program costs) ÷ Program costs × 100
To estimate benefits, use assumptions you can defend. Good inputs include fewer avoidable early departures and measured savings in HR admin time. Skip vague claims like “better culture.”
A Worked Example of Onboarding ROI
This example is hypothetical and meant only to show the math.
A company hires 100 people a year. Its 90-day turnover is 15%, so 15 hires leave early. The team adds a structured 30/60/90-day plan and manager check-ins. Next year, 90-day turnover drops to 12%, so 12 hires leave.
- Departures avoided: 3
- Avoidable replacement cost per departure (assumed): $8,000, so $24,000 saved
- HR admin time saved through better workflows (assumed): $7,000
- Total benefits: $31,000
- Program cost (training managers, materials, tools): $10,000
- Net benefit: $21,000
- ROI = ($31,000 − $10,000) ÷ $10,000 × 100 = 210%
Before you claim a result like this, check whether other changes, such as a hiring freeze or a pay increase, could explain it.
Employee Onboarding Duration and Preboarding Statistics
How Long Do Organizations Spend Onboarding New Hires?
Reported durations vary widely. Some employers treat onboarding as a one-day orientation. Others run structured programs lasting several months or a year.
When you compare durations, check the survey’s method first. Ask who was surveyed, what counted as onboarding, and when the data was collected. A figure without those details isn’t a benchmark.
What Is Preboarding, and How Common Is It?
Preboarding is everything that happens between the accepted offer and the first day. It typically covers:
- Paperwork and e-signatures
- Equipment shipping or setup
- Account and system access
- A welcome message from the manager
- Introductions to the team
I haven’t found a reliable, broadly representative figure for how common preboarding is, so I won’t invent one. You can still measure it internally: what share of your hires have working equipment and accounts on day one?
Why Onboarding Should Continue Beyond the First Week
A great first day can fade by week three if nothing follows. Ongoing onboarding should include role-specific training, regular manager check-ins, social integration, and feedback tied to milestones.
What Should an Onboarding Timeline Include?
| Period | Suggested focus | Example measures |
| Before Day 1 | Preparation and access | Equipment readiness, document completion |
| Days 1–7 | Orientation and connection | Access issues, satisfaction, role clarity |
| Days 8–30 | Role learning | Training completion, early milestones |
| Days 31–60 | Increasing independence | Manager feedback, progress against goals |
| Days 61–90 | Performance and integration | Retention, proficiency milestones, engagement |
| Months 4–12 | Sustained development | Longer-term performance and retention |
This is a suggested framework, not a rule. Adjust it to your roles. Writing
Businesses looking to streamline these processes can explore this guide to employee onboarding software and its role in managing new-hire tasks, training, and progress.
Manager Involvement, Mentoring, and Onboarding Support Statistics
How Much Does Manager Involvement Matter?
Research from Gallup and others consistently points to managers as a major factor in employee engagement, and new hires are no exception. A manager shapes expectations, gives early feedback, and removes obstacles.
In practice, the managers who help most do three things. They explain what success looks like. They meet one-on-one every week during the first month. And they give honest feedback early.
Employee Onboarding Buddy and Mentoring Programs
A buddy is a peer who answers everyday questions. A mentor offers longer-term guidance. Both support informal learning and help new hires feel they belong.
Be careful with the evidence. Studies on mentoring in general don’t automatically prove that onboarding buddies improve outcomes. If you launch a buddy program, measure it yourself: participation, satisfaction, and 90-day retention for buddied versus non-buddied hires.
The Recruiting-to-HR-to-Manager Handoff
Here is a common scenario. Recruiting promises a remote-work arrangement, HR doesn’t know, and the manager finds out on day one. The new hire’s first impression is a muddle.
Fix it with clear ownership:
- Recruiting: passes on all commitments made during hiring.
- HR: handles paperwork, compliance, and orientation.
- Manager: owns role clarity, goals, and weekly check-ins.
Then track whether equipment, access, training, and meetings were ready on time.
Remote, Hybrid, and In-Person Onboarding Statistics
Remote Onboarding Statistics
Remote new hires tend to struggle most with connection, informal learning, and knowing whom to ask. Culture is harder to absorb through a screen.
Use research that specifically surveys remote hires. Pandemic-era studies often mix people who had never met their colleagues with people who had worked together for years.
Hybrid Onboarding Statistics
Hybrid onboarding adds a coordination problem. If the new hire is in the office on days when the team is remote, the benefit of being in person disappears.
Solve this by scheduling a new hire’s first weeks around the team’s in-office days. Comparable satisfaction data across hybrid models is still limited, so I won’t quote a figure.
In-Person Onboarding Benchmarks
In-person onboarding makes it easy to learn by observation, pick up unwritten rules, and meet people informally. It also suits hands-on training, such as equipment, safety, and customer-facing work.
Remote vs. Hybrid vs. In-Person Onboarding
A fair side-by-side table needs matching definitions, populations, and survey periods. Today, I’m not aware of public data that meets all three conditions. Rather than force a misleading comparison, I’d suggest comparing your own cohorts by work model. Track the same metrics, such as 90-day retention and time to productivity, for each group.
HR Technology, Automation, and AI Onboarding Statistics
How Common Is Onboarding Software?
Adoption has grown, especially among larger employers. But adoption is not effectiveness. Owning a platform doesn’t mean new hires like it or that it saves time.
Ask two questions: does the tool get used, and does it improve any outcome you measure?
How Automation Affects Onboarding Administration
Automation works best on repetitive tasks such as:
- Sending and collecting documents
- Routing approvals
- Creating accounts and permissions
- Syncing data between HR and IT systems
Measure processing time, error rates, delays, and HR hours spent per hire, before and after.
AI in Employee Onboarding
AI tools are now being used to answer new-hire questions, recommend learning paths, send reminders, and support workflows. Adoption is changing quickly, so check a current source before citing any percentage.
Also separate what vendors claim from what is independently shown. Many reported benefits come from vendor case studies, not neutral research.
How to Measure Whether Onboarding Technology Works
Track these:
- Time saved per hire
- Completion and error rates
- New-hire satisfaction
- Whether people actually use it
- Integration failures
- Data privacy and compliance risks
Employee Onboarding Compliance and Readiness Benchmarks
Completion of Required Documents and Training
Measure how many hires finish required items before their deadlines. Then check accuracy, because a completed form with errors is still a problem. Completion shows activity, not compliance.
Equipment, Accounts, and System Access
A new hire can’t work without tools. Track how many have equipment and access on day one, how long delays last, and which technical issues remain open after the first week.
Industry and Location-Specific Requirements
Legal requirements differ by country, state, and industry. Healthcare, finance, and manufacturing often carry extra training or certification rules. Always use official government or regulator sources, not statistics roundups, to confirm what the law requires.
Employee Onboarding Statistics and Industry Benchmarks: How to Compare Fairly
This is where many articles go wrong. They list industry “targets” with no source. I won’t. If trustworthy, comparable data doesn’t exist for your industry, the honest answer is to say so and build your own baseline.
Onboarding Benchmarks by Industry
Needs differ by sector:
- Retail: high volume, seasonal hiring, short ramp-up.
- Healthcare: heavy compliance, credentialing, and safety training.
- Manufacturing: safety and hands-on skills come first.
- Technology: access to systems and tools, plus team integration.
- Professional services: client readiness and knowledge transfer.
For broader turnover context by industry, the BLS JOLTS survey is a reliable public source. Note that it measures total separations, not new-hire turnover.
Benchmarks by Company Size
Small businesses usually have little HR staff but close contact between owners and new hires. Mid-sized firms are building repeatable systems. Large enterprises often have formal programs but risk making them impersonal. Compare yourself against firms of similar size.
Benchmarks by Role and Seniority
Frontline hires need speed and clarity. Professionals need domain context and access. Senior leaders need stakeholder relationships and strategic alignment, which take longer. A single onboarding benchmark can’t cover all three.
How to Choose a Relevant Benchmark
To compare like with like:
- Use the same metric definition.
- Match the measurement period.
- Check geography and workforce type.
- Check the sample and the research date.
- Compare similar roles or industries where possible.
- Use your own cohort trends when external data isn’t available.
The Most Important Employee Onboarding Metrics and KPIs
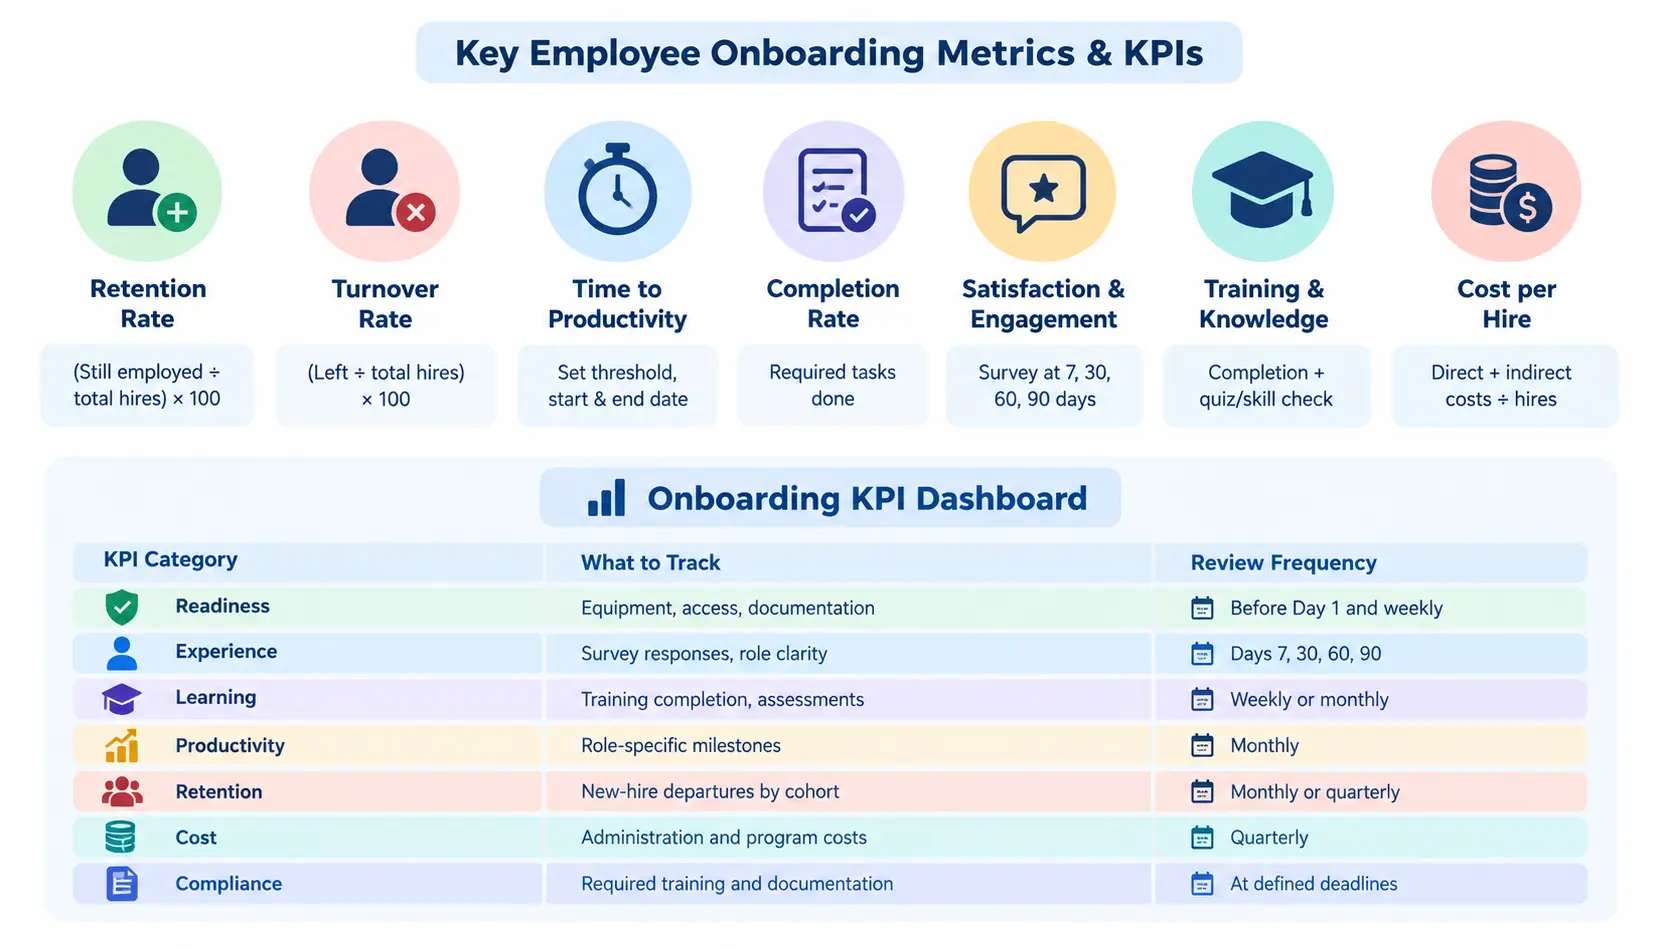
New-Hire Retention Rate
New-hire retention rate = (hires from a cohort still employed at day X ÷ total hires in the cohort) × 100
Define the cohort (for example, everyone hired in Q1), the window (such as 90 days), and how you treat departures such as internal transfers.
New-Hire Turnover Rate
This is the flip side: the percentage of a cohort who left in the window. Report voluntary and involuntary exits separately.
Time to Productivity
Set the performance threshold, the start date, and the end date. Document them for each role so every manager measures the same way.
Onboarding Completion Rate
This shows how many required tasks are done. It does not show whether the person feels ready. Pair it with a readiness question in your surveys.
New-Hire Satisfaction and Engagement
Survey at days 7, 30, 60, and 90. Combine scores with open-ended questions such as “What would have made your first week easier?” The comments usually tell you more than the numbers.
Training Completion and Knowledge Retention
Course completion shows attendance. Add a short quiz or a demonstrated skill to see what stuck.
Cost per Onboarded Employee
Add direct costs (equipment, software, materials) and indirect costs (HR and manager time), then divide by the number of hires. Write down your assumptions so the number can be repeated next year.
A Complete Employee Onboarding KPI Dashboard
| KPI category | What to track | Review frequency |
| Readiness | Equipment, access, documentation | Before Day 1 and weekly |
| Experience | Survey responses, role clarity | Days 7, 30, 60, 90 |
| Learning | Training completion, assessments | Weekly or monthly |
| Productivity | Role-specific milestones | Monthly |
| Retention | New-hire departures by cohort | Monthly or quarterly |
| Cost | Administration and program costs | Quarterly |
| Compliance | Required training and documentation | At defined deadlines |
These are suggested intervals, not industry standards.
How to Improve Onboarding Using the Statistics
Establish a Baseline
Pull your last two years of data. Check whether managers and HR define “new hire,” “productive,” and “early turnover” the same way. Then segment results by role, department, location, and hiring cohort. Identifying common training barriers can help HR teams prioritize improvements, as explained in this guide to employee training challenges and how to solve them.
Fix High-Impact Process Problems
Start with problems that cause the most friction:
- Equipment and access delays
- Unclear responsibilities between recruiting, HR, and managers
- Inconsistent training
- Managers who haven’t been briefed on what to do
Extend Support Beyond Orientation
Build a 30/60/90-day plan. Schedule weekly manager check-ins for the first month. Add role-specific learning and create chances to meet peers, such as a team lunch or a buddy.
Run a Measurable Improvement Cycle
Treat each change like a small experiment:
- Identify the problem.
- Choose one intervention.
- Define the success metric.
- Compare results with your baseline.
- Check for unintended side effects.
- Adjust and repeat.
How to Interpret Employee Onboarding Statistics Correctly
Why Statistics From Different Studies May Conflict
Studies differ in sample size, country, industry, question wording, definitions of success, and when the data was collected. Two accurate numbers can look contradictory for these reasons alone.
Correlation vs. Causation
Companies with better onboarding often have better managers, better pay, and better hiring, so a link between onboarding and retention does not prove onboarding alone caused it.
How to Spot Outdated or Misleading Onboarding Statistics
Before you trust a number:
- Trace it back to the original source.
- Check that the research year is stated.
- Look for the sample and population.
- Ask whether a vendor-sponsored study is being applied to all employers.
- Never merge incompatible statistics into one benchmark.
HR practitioners often compare notes on these topics in communities such as humanresources. These discussions are useful for real-world experience, but they aren’t a substitute for primary research.
How This Article Selects and Verifies Its Sources
I gave priority to original research from established bodies such as Gallup, SHRM, and the U.S. Bureau of Labor Statistics. Vendor surveys are labeled as such. Where a figure is widely repeated but I could not confirm its original source or method, I said so or left it out. Where no comparable data exists, I offered a measurement framework instead of a made-up number.
Frequently Asked Questions About Employee Onboarding Statistics
1. What are the most important employee onboarding statistics?
The most cited are Gallup’s finding that about 12% of employees strongly agree with their organization onboards well, and Gallup’s estimate that replacing an employee can cost half to twice their salary. Always check the source year and method.
2. What percentage of employees say their onboarding is effective?
Gallup found about 12% strongly agree their organization does a great job. That counts only top ratings, so it understates the number who are at least somewhat satisfied.
3. How long should employee onboarding last?
There is no single standard. A practical approach is to plan for at least the first 90 days, with lighter support through month 12, adjusted for role complexity.
4. What is a good new-hire retention rate?
No reliable universal number exists. A good rate is one that beats your own past cohorts and holds up against similar roles in your industry.
5. How do you measure onboarding suyee productivity?
Structured onboarding is linked to faster ramp-up, mostly in survey research. Evidence from controlled studies is limited, so measure your own results.
7. What is the cost of poor onboarding?
It includes early turnover, rehiring, retraining, and slower output. Gallup’s estimate for replacement is half to twice the employee’s annual salary, though not every exit is due to onboarding.
8. How do you calculate onboarding ROI?
Subtract program costs from measured benefits, divide by program costs, and multiply by 100. Use defensible benefits such as avoided replacement costs and admin time saved.
9. Which onboarding metrics should HR teams track?
Start with new-hire retention, new-hire turnover, time to productivity, completion rate, satisfaction, training results, and cost per hire onboarded.
10. How can small businesses improve onboarding?
Write a simple 30/60/90-day plan, prepare equipment before day one, assign a buddy, and hold weekly check-ins during the first month. These steps cost little.
Conclusion
The best use of employee onboarding statistics and industry benchmarks is not to copy someone else’s number. It is to learn what to measure, spot where your process leaks, and improve one thing at a time.
Start small. Pick three metrics, such as 90-day retention, time to productivity, and day-one readiness. Record your baseline, make one change, and measure again. Over a year, those small, tracked steps will tell you more than any industry average.